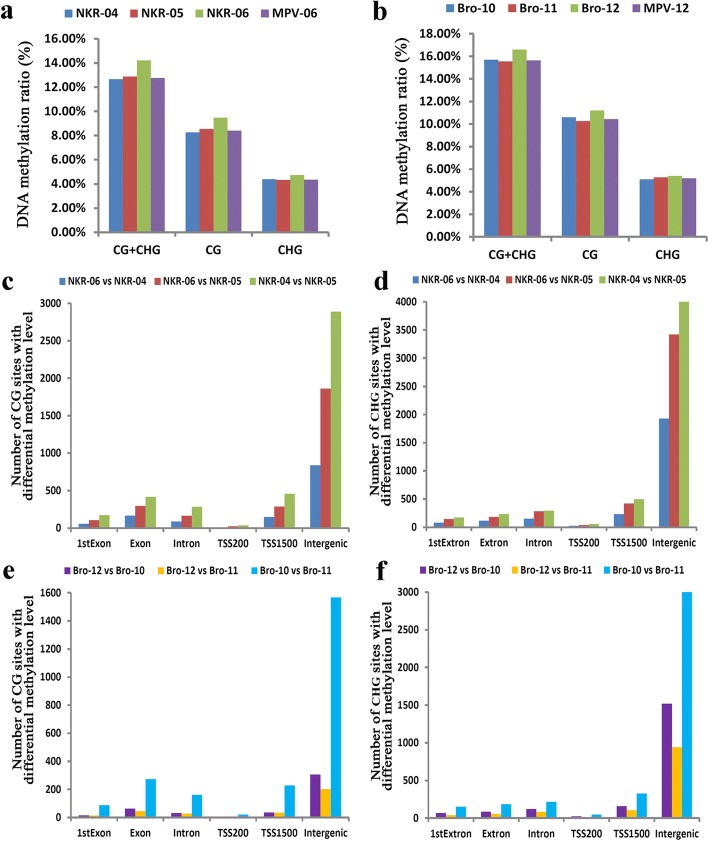
Fig. 7.
DNA methylation ratio and distributions of CG and CHG sites with differential methylation levels. a and (b) indicated the genomic DNA methylation ratio at CG and CHG sites in the NKR-04/− 05/− 06 hybrid triad and the Bro-10/− 11/− 12 hybrid triad, respectively. c and d indicated the distributions of CG (c) and CHG (d) sites with differential methylation levels in the NKR-04/− 05/− 06 hybrid triad; e and f indicated the distributions of CG (e) and CHG (f) sites with differential methylation levels in the Bro-10/− 11/− 12 hybrid triad. 1stExon, Exon, intron, TSS200 and TSS1500 indicated the regions of the first exon, the whole exons of genes, the whole introns of genes, the upstream 200 bp of the transcription termination site (TSS) and the upstream 1500 bp of TSS, respectively. “intergenic” indicated the intergenic regions

