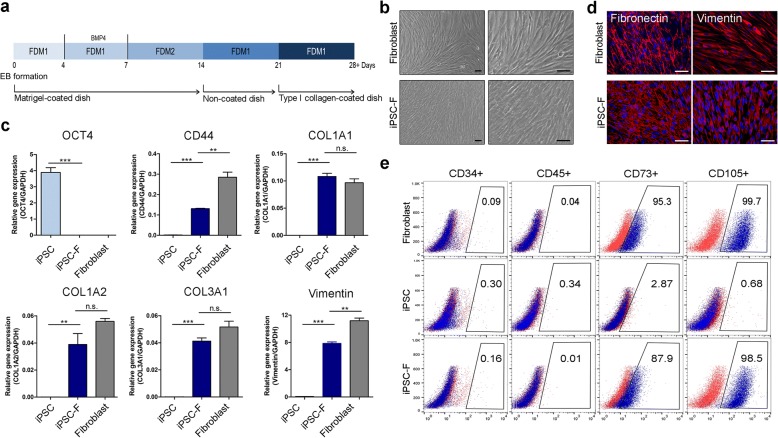
Fig. 1.
Differentiation of CBMC-iPSC-Fs. a Schematic of fibroblast differentiation process. b Morphology of iPSC-Fs on day 30. Scale bars, 100 μm. c Gene expression of pluripotency marker OCT4 and fibroblast markers CD44, COL1A1, COL1A2, COL3A1, and vimentin. d Immunocytochemical analysis of fibroblast markers fibronectin (red) and vimentin (red), together with DAPI staining (blue). Scale bars, 100 μm. e Flow cytometric analysis of CD34-positive, CD45-positive, CD73-positive, and CD105-positive cells. Graphs show mean with SEM of five independent samples. **p < 0.01, ***p < 0.001. EB embryoid body, FDM fibroblast differentiation medium, GAPDH glyceraldehyde 3-phosphate dehydrogenase, iPSC induced pluripotent stem cell, iPSC-F iPSC-derived fibroblast, n.s. not significant

