Fig. 5.

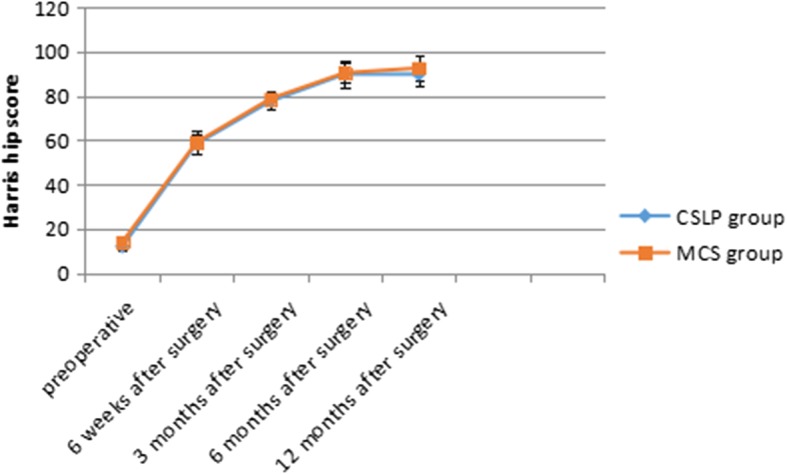
This figure illustrates the Harris Hip Scores for both groups from the preoperative to the postoperative periods. Note the increasing trend in postoperative scores for both groups

This figure illustrates the Harris Hip Scores for both groups from the preoperative to the postoperative periods. Note the increasing trend in postoperative scores for both groups