Fig. 9.
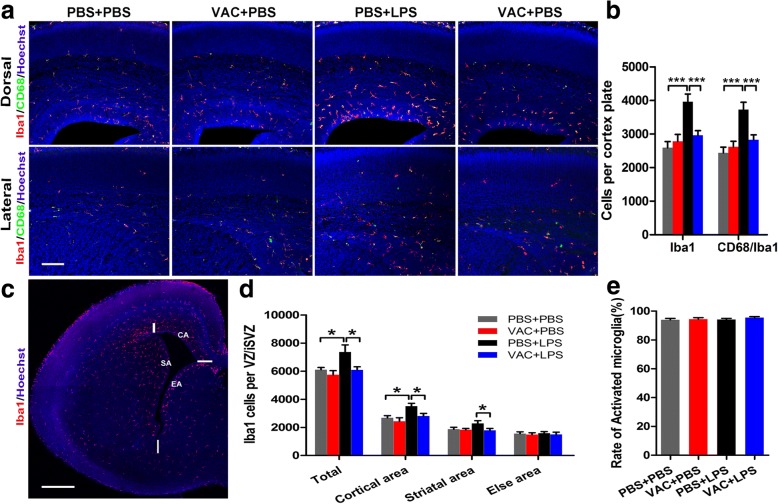
Effects of maternal VAC and MIA on central inflammatory response at E18.5. Representative images of staining with Iba1 (red), CD68 (green), and Hoechst (blue) in the cortical (a) and hemispherical (c) areas in fetal brains at E18.5. b ANOVA showed a significant main effect of MIA (F1,12 = 16.135, p = 0.002) and interaction effect between MIA and VAC (F1,12 = 9.479, p = 0.01) for the number of Iba1+ cell. Similar result was shown for CD68+ cells, main effect of MIA: F1,12 = 17.996, p = 0.001; interaction effect between MIA and VAC: F1,12 = 9.311, p = 0.01. Post hoc test revealed that VAC pretreatment rescued the MIA-induced accumulation of Iba1+ cells and CD68+ cells in the cortical plate (p < 0.001). d Similar results were observed in the VZ/SVZ, especially in cortex-related areas. There were significant main effects of MIA (F1,12 = 6.170, p = 0.029) and VAC (F1,12 = 6.332, p = 0.027) for total Iba1+ cells in VZ/SVZ. A significant main effect of LPS (F1,12 = 8.411, p = 0.013) and VAC (F1,12 = 5.219, p = 0.049) for Iba1+ cells was quantified in the CA. e The ratio of CD68+ cells to Iba1+ cells (the proportion of activated microglia) did not differ among the four groups (p > 0.05). n = 4 mice/group; *p < 0.05, ***p < 0.001 (two-way ANOVA and Bonferroni post hoc test). The results are all shown as the mean + s.e.m. Scale bars, 100 μm in a, 500 μm in c

