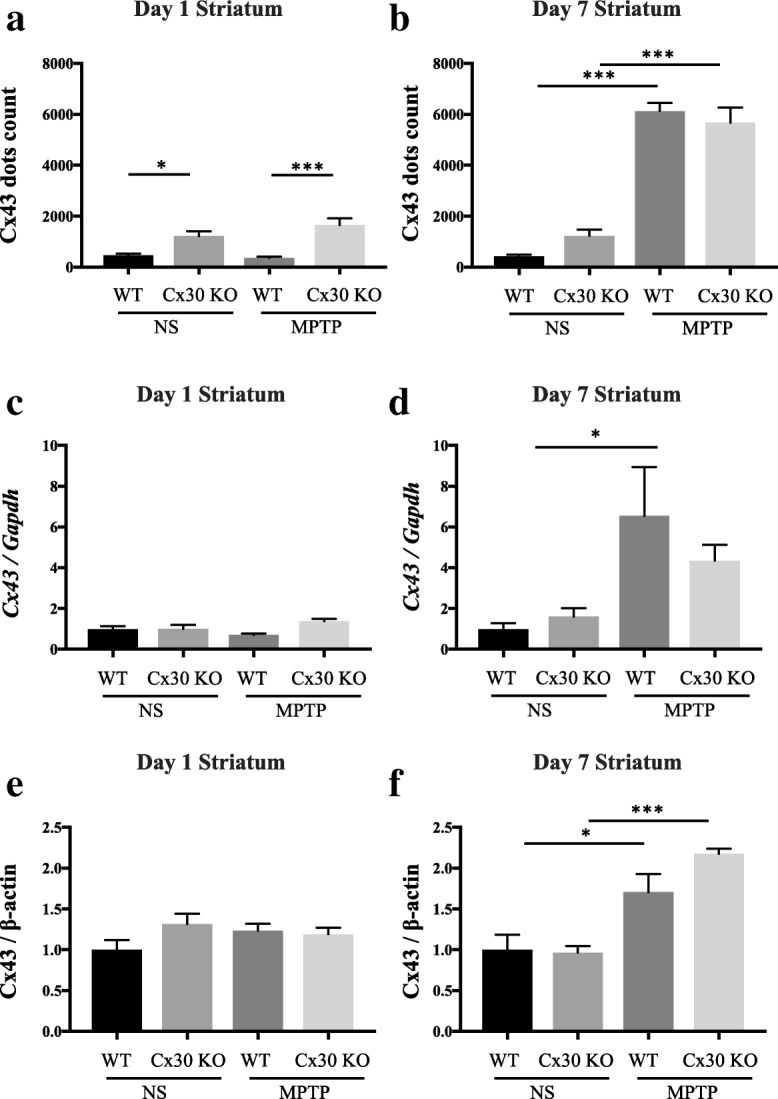
Fig. 3.

Effects of MPTP on Cx43 expression in the striatum of WT and Cx30 KO mice on days 1 and 7 after the treatment with normal saline (NS) or MPTP. a, b Number of Cx43-immunoreactive dots counted by Nikon NIS-Element software. c, d, qRT-PCR analysis of Cx30 mRNA levels normalised to Gapdh mRNA. e, f Cx30 protein levels measured by Western blotting and normalised to β-actin levels. Analyses were performed on day 1 (a, c, e) and day 7 (b, d, f) after treatment. Data are presented as the mean ± SEM of n = 4–5 mice per group. *p < 0.05 and ***p < 0.001 by two-way ANOVA followed by the Tukey–Kramer post hoc test. Blot images are presented in Additional file 1: Figure S2
