Fig. 6.
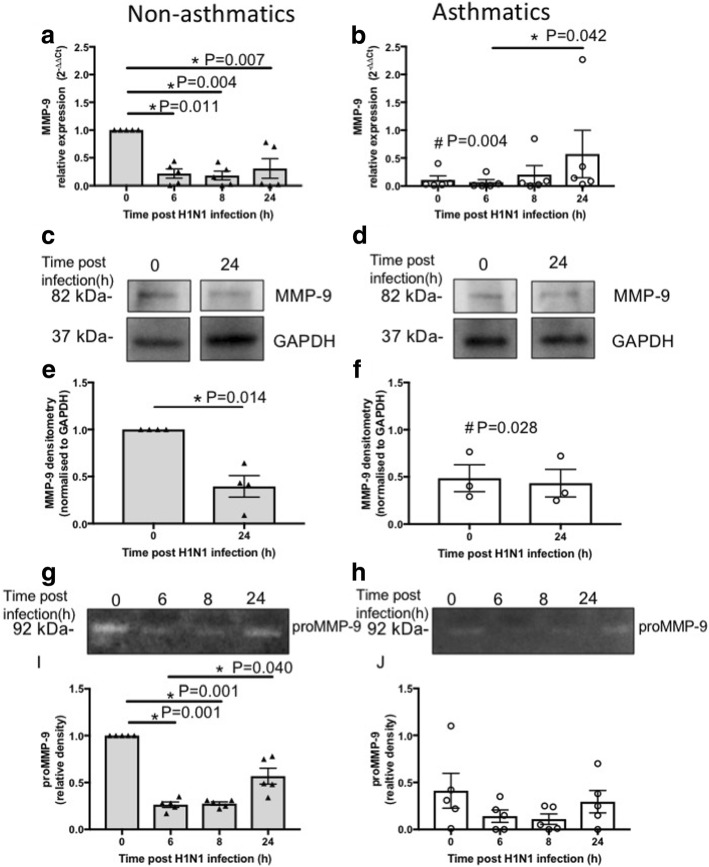
MMP-9 expression and activity in pBECs from non-asthmatics and asthmatics cultured at ALI. Cells were infected with IAV H1N1 (MOI 5) and MMP-9 expression was assessed at different time points. a and (b) mRNA expression of MMP-9 at baseline and after IAV H1N1 infection (6–24 h) in non-asthmatics and asthmatics. The cycle threshold (Ct) value was normalised to the 18S gene (∆Ct) and data are presented relative to corresponding non-asthmatics at baseline. *P ≤ 0.05 intra-cohort, and #P ≤ 0.05 inter-cohort between corresponding time points, using the Kruskal Wallis multiple comparisons test and Mann-Whitney test, respectively, N = 5. c and (d) are immunoblots representative of baseline and 24 h after infection in non-asthmatics and asthmatics, respectively. e and (f) Densitometric quantification of MMP-9 immunoblots. Data are presented relative to corresponding non-asthmatic levels at baseline. *P ≤ 0.05, using non-parametric test, N ≥ 4. g and (h) Representative zymograms after infection (0–24 h) in non-asthmatics and asthmatics. i and (j) Densitometric quantification of zymograms. Data are presented relative to corresponding non-asthmatic levels at baseline. *P ≤ 0.05 intra-cohort, and #P ≤ 0.05 inter-cohort between corresponding time points, using the Kruskal Wallis multiple comparisons test, N = 5

