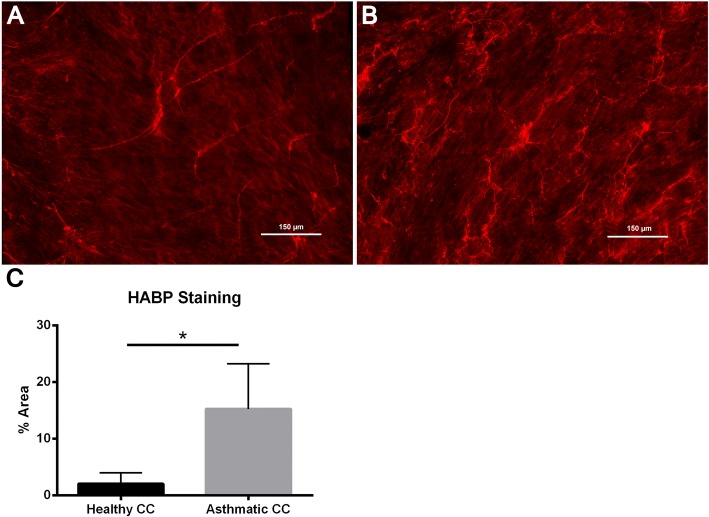
Fig. 2.
Imaging studies were performed to label HA deposition (red) by HLFs in a healthy and b asthmatic BEC/HLF co-cultures. Representative images are shown for each condition. c Quantitative analysis of HA staining demonstrated that HLFs co-cultured with asthmatic BECs displayed greater HA labeling by % area compared to HLFs co-cultured with healthy BECs (P < 0.0001). Data shown as mean ± SD for N = 5 replicates/group

