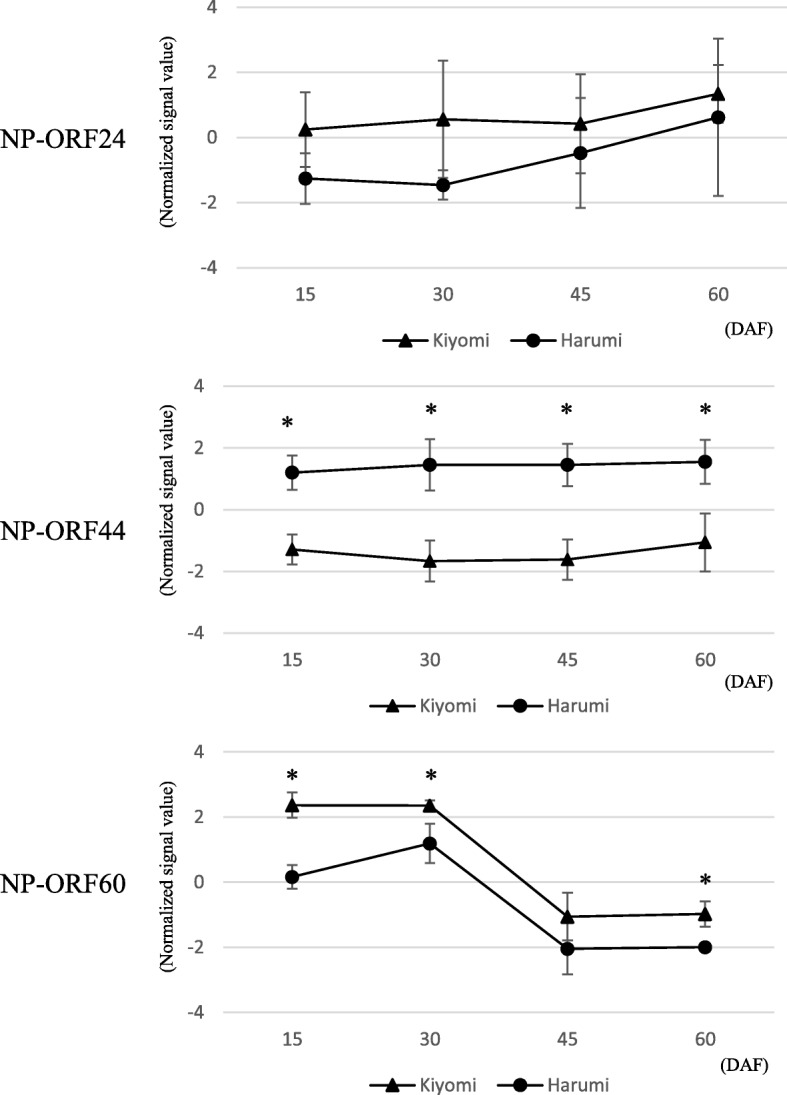
Fig. 1.

Microarray expression patterns of three selected genes in young whole fruits at 15–60 DAF of ‘Kiyomi’ (monoembryonic variety) and ‘Harumi’ (polyembryonic variety). The expression values of each candidate gene indicate the average normalized expression values of their probes. Each error bar indicates standard deviation among expression values of oligonucleotide probes derived from different exons in the same gene. Samples showing significant differences at P < 0.05 between ‘Kiyomi’ and ‘Harumi’ are marked with an asterisk
