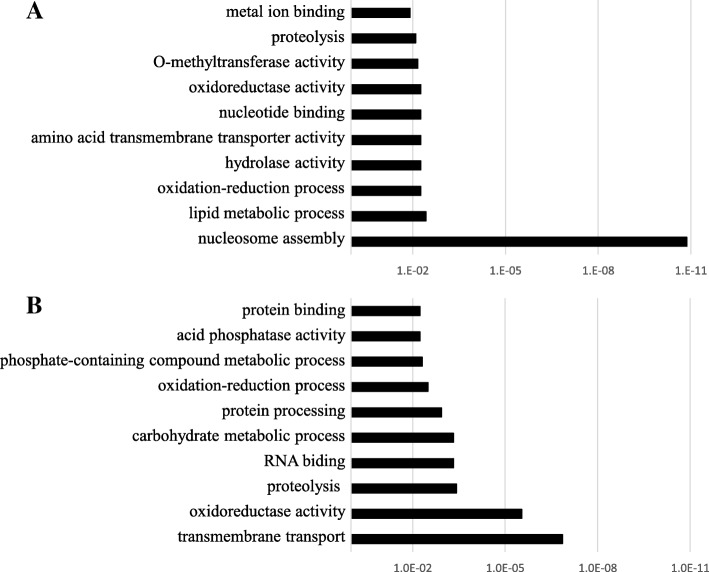
Fig. 3.
GO term enrichment analysis of highly expressed genes (a) and weakly expressed genes (b) using 356 genes with more than 2-fold differences in expression ratios between of ‘Kiyomi’ (monoembryonic variety) and ‘Harumi’ (polyembryonic variety) during whole experimental period. The Y-axis indicates the Fisher’s test P-value (−log10)

