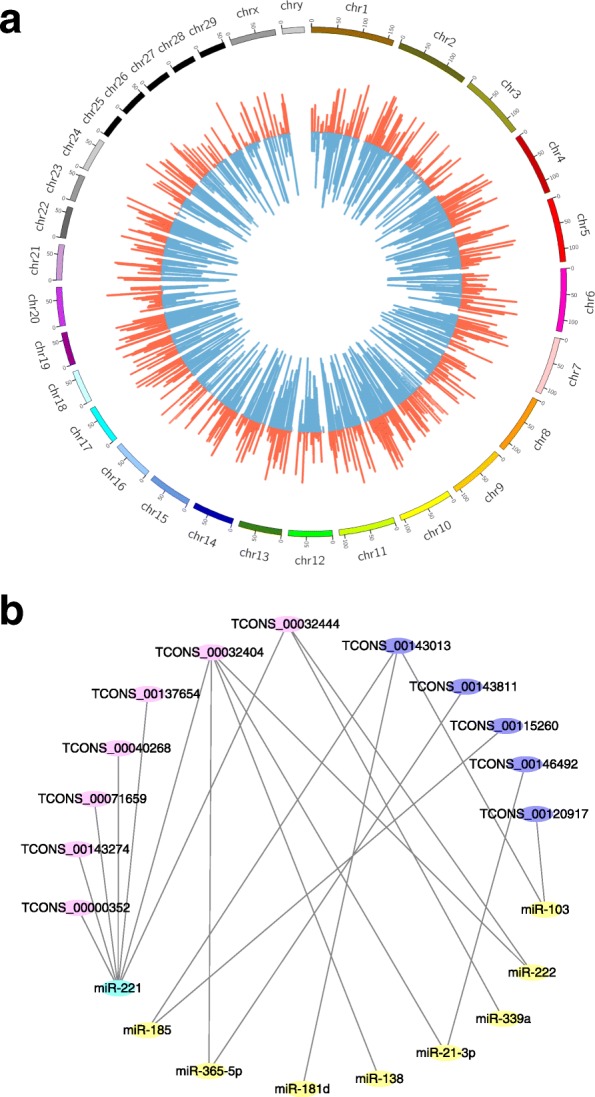
Fig. 4.

DEGs, DELs and its potential interacted miRNAs. a Chromosome distribution of DELs and DEGs by using Circos. Red columns represent DEGs, and blue bars represent DELs. b The interaction network between DELs and their potential interacted miRNAs. Those lncRNAs were depicted as pink and purple, and miRNAs as blue and yellow
