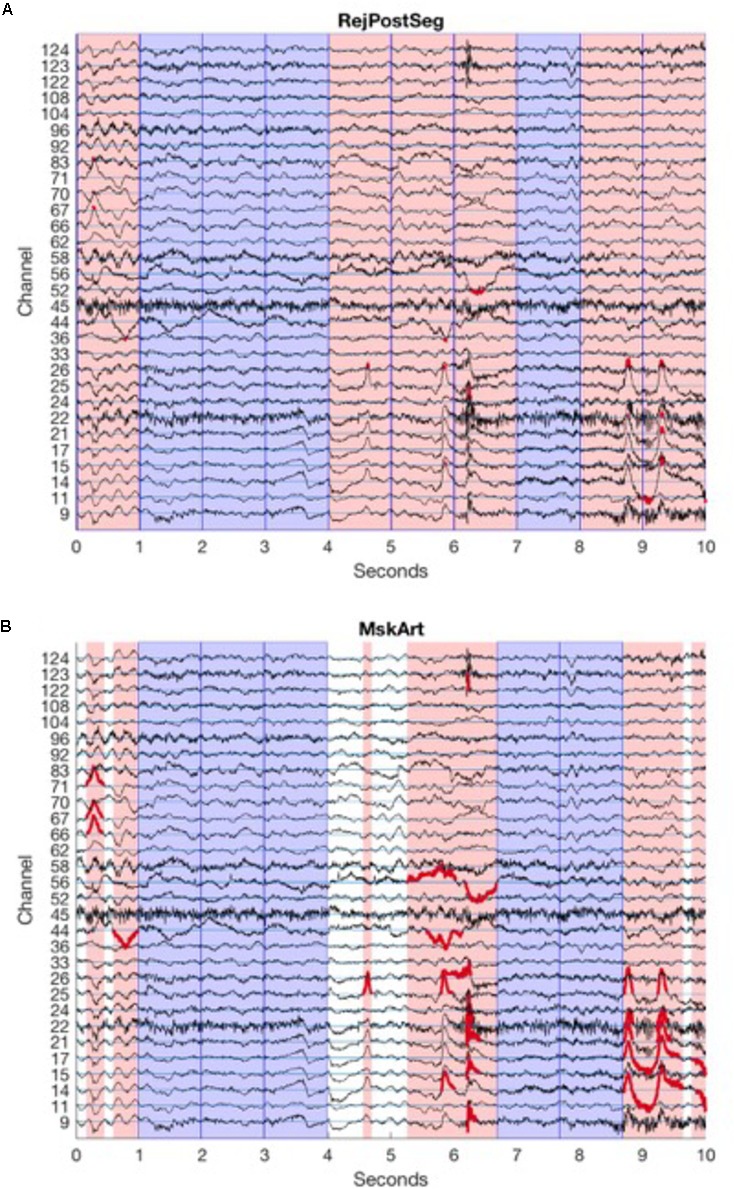
FIGURE 2.

Segmentation and amplitude thresholding. Channels are arranged vertically, with horizontal channel reference lines in cyan. For clarity, only those channels that are part of the 10–20 system, and those channels that cross the amplitude threshold in this portion of the EEG, are shown here. EEG tracings for each channel are in black. Reference lines are spaced by 100 μV, equal to amplitude threshold, so that above-amplitude portions of tracing cross another channel’s reference line. Dark blue vertical lines indicate segment boundaries; in this example, 1 s segments are created from continuous data. Sample data here are from baselineEEG08.mat, samples 13,250:15,750, after PREP, filtering (1 Hz high pass, 100 Hz low pass), and mean detrending. (A) Amplitude thresholding after segmentation. Pink patches demonstrate segments rejected because at least one channel crosses the artifact threshold. Portions of the EEG tracing that are above the amplitude threshold (and thus lead a segment to be rejected) are in red. Blue patches demonstrate good segments to be analyzed. (B) Amplitude thresholding before segmentation. Pink patches demonstrate segments rejected because at least one channel crosses the artifact threshold; length of segment spans from zero-crossing before the segment crosses the artifact threshold to zero-crossing after the segment crosses the artifact threshold. Portions of the EEG tracing that are above the amplitude threshold, extending out to the zero-crossing on either side (thus determining the boundaries for rejected segments) are in red. Blue patches demonstrate good segments to be analyzed. White patches demonstrate remaining segments of good data that are too short for analysis.
