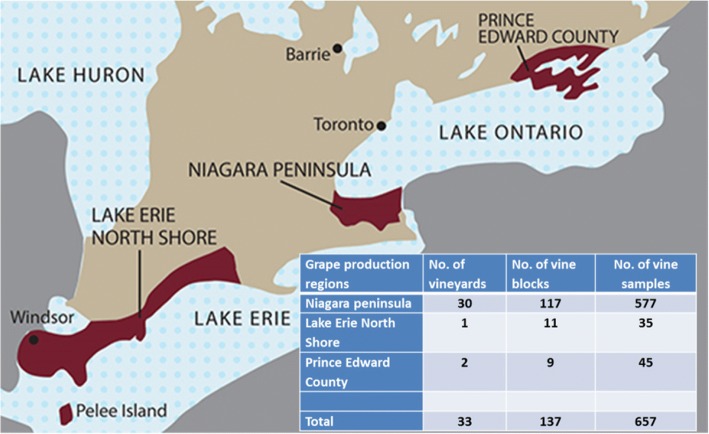
Fig. 1.
Sampling of grapevines across the three primary appellations in Ontario for use in virus survey. The map is from http://www.vintages.com/images/ontario_wine_region-map.jpg. The insert table shows the numbers of samples, numbers of vine blocks and vineyards that were sampled from the three appellations in the province. Each sample is comprised of two basal leaves per vine from five vines in a vine panel (total of 10 leaves for each composite sample)

