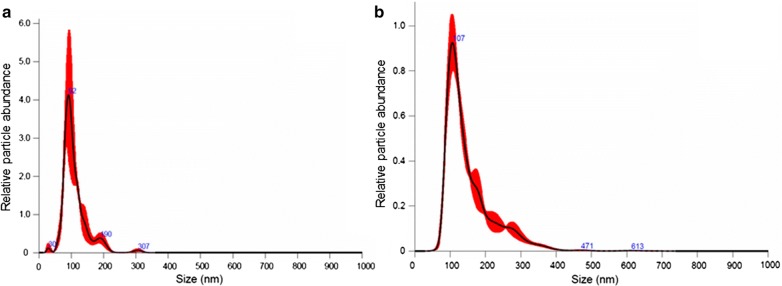
Fig. 2.
Nanosight analysis. The x-axis indicates the size distribution of particles, while y-axis shows the relative counts. The red-smear denotes variation as standard error of mean. a Size of most of the particles was 92 nm in baseline (no radiation) sample, b size of most of the particles were 107 nm in FUP (radiation)

