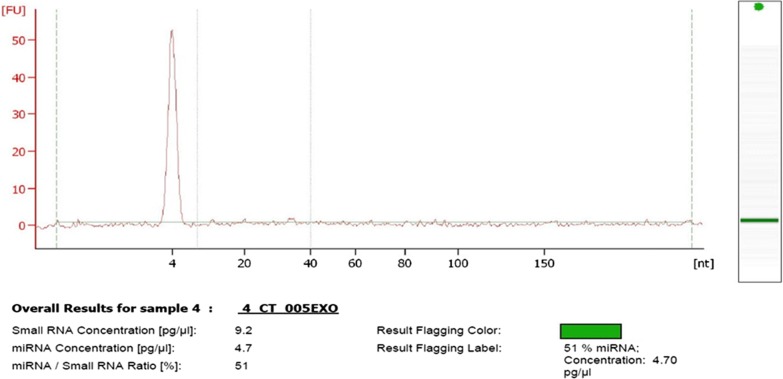
Fig. 5.
Small RNA profile from serum exosomes measured by Agilent Small RNA kit. The representative electropherograms showing nucleotide size (x-axis) between 4 and 40 as indicated my vertical lines is the region for miRNAs while peak at 4 nucleotide represents internal standards. The y-axis represents fluorescence units (FU)

