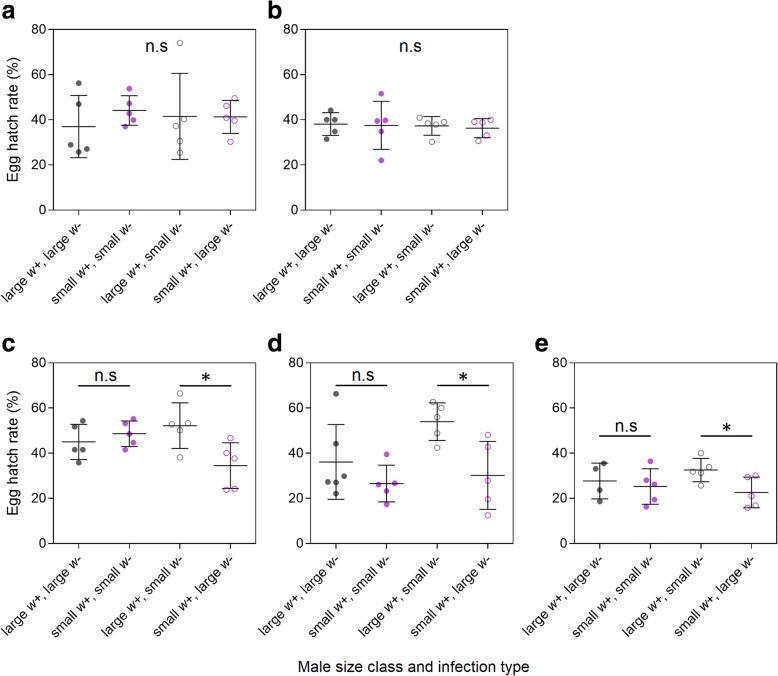
Fig. 2.
Egg hatch rates from crosses with uninfected females and both infected (w+) and uninfected (w-) males of different size class combinations. Comparisons were carried out twice for large females (a, b) and three times for small females (c-e). Each data point represents the egg hatch rate of all eggs from a single cage of 50 females. Error bars are standard deviations. Hatch proportions that were significantly different (P < 0.05) between treatments by t-test are indicated by asterisks. Abbreviation: n.s, non-significant

