
Fig. 2.
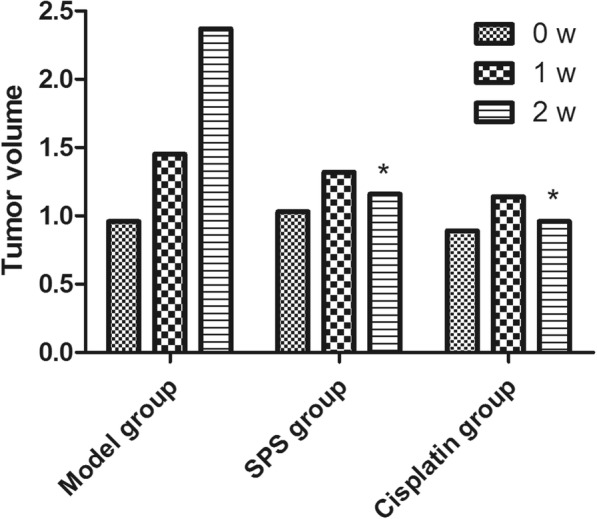
The tumor volume of mice in the model, SPS, and cisplatin groups after intervention for 1 and 2 weeks. The data are presented as the mean ± standard deviation. *P < 0.05 compared with the model group after the same treatment time
Official websites use .gov
A
.gov website belongs to an official
government organization in the United States.
Secure .gov websites use HTTPS
A lock (
) or https:// means you've safely
connected to the .gov website. Share sensitive
information only on official, secure websites.
The tumor volume of mice in the model, SPS, and cisplatin groups after intervention for 1 and 2 weeks. The data are presented as the mean ± standard deviation. *P < 0.05 compared with the model group after the same treatment time