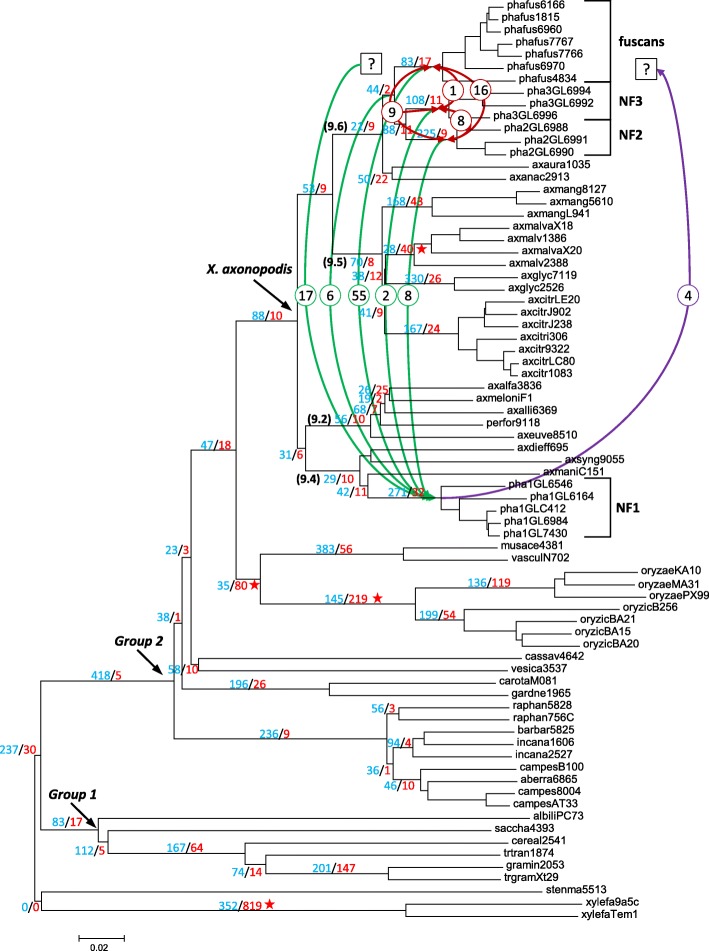
Fig. 1.
Phylogeny of Xanthomonas strains used in this study. Phylogeny of Xanthomonas strains used in this study with indication of gene gains and losses. The phylogenetic tree is based on whole genome analysis using CVTree [66] with default parameters. Strain aliases are described in Table 1. Stenotrophomonas and Xylella genomes have been used as outgroups. Xanthomonas main phylogenetic groups 1 and 2 [24] and the X. axonopodis species complex [9, 10] are indicated by arrows. Groups 9.2, 9.4, 9.5 and 9.6 [11] are indicated in brackets. Fuscans, NF2, NF3 and NF1 refer to the four genetic lineages of strains responsible for CBB. A parsimony approach was performed to infer gene gains (blue) and losses (red) at levels higher than the pathovar rank, and numbers are displayed at each branch. Red stars highlight cases where gene loss was greater that gene gain. Curved arrows represent horizontal gene transfers (HGT) retrieved by Ks analysis on alignments of 115 candidate genes for bean specificity, with HGT from X. citri pv. fuscans to X. phaseoli pv. phaseoli in green, HGT from X. phaseoli pv. phaseoli to X. citri pv. fuscans in purple, and HGT between X. citri pv. fuscans lineages in red. Numbers in circles correspond to the numbers of candidate genes involved for each HGT. Question marks indicate events for which the origin or end of the HGT was not precise enough to assign any particular lineage

