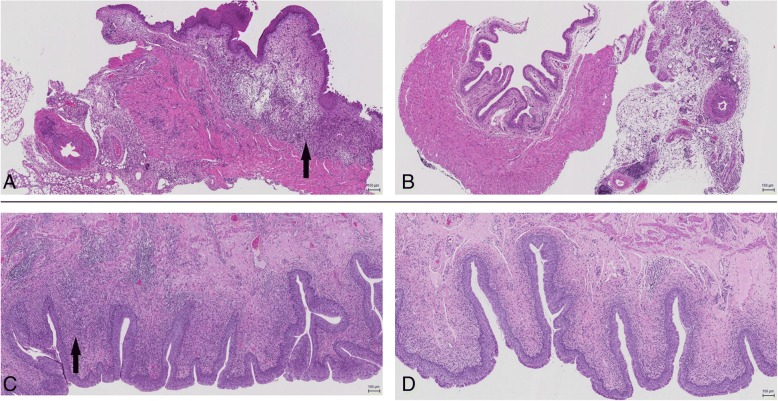
Fig. 6.
Representative hematoxylin and eosin staining (scale bars 100 μm) of 5 μm section of urinary bladders of a) Mice with uncoated catheter and b) Mice with P3 coated catheter c) Pigs with silver coated Dover™ catheter and d) Pigs with P3 coated catheter. Images suggest a higher granulocyte infiltration in the sub-mucosal layer (indicated by black arrows) in a and c as compared to that in b and d respectively

