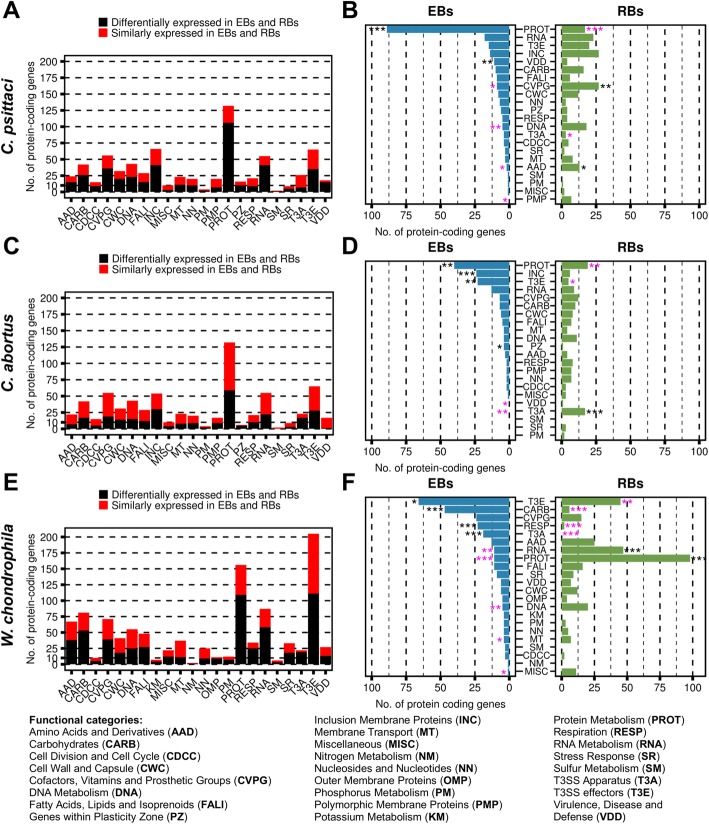
Fig. 2.
EBs and RBs show highly diverse gene expression in C. psittaci, C. abortus and W. chondrophila. The left panel shows the number of similarly and differentially expressed genes in the assigned functional categories for C. psittaci (a), C. abortus (c) and W. chondrophila (e). About half of all genes are differentially expressed in EBs and RBs (black) in all three species. The right panel shows the number of up-regulated genes in EBs (blue) and RBs (green) in C. psittaci (b), C. abortus (d) and W. chondrophila (f) within each functional category. Overrepresentation (black asterisks) and underrepresentation (magenta asterisks) of genes within the functional categories are indicated. Significance threshold is depicted by asterisks and represent p-value < 0.05 (*), p-value < 0.01 (**) and p-value < 0.001 (***)

