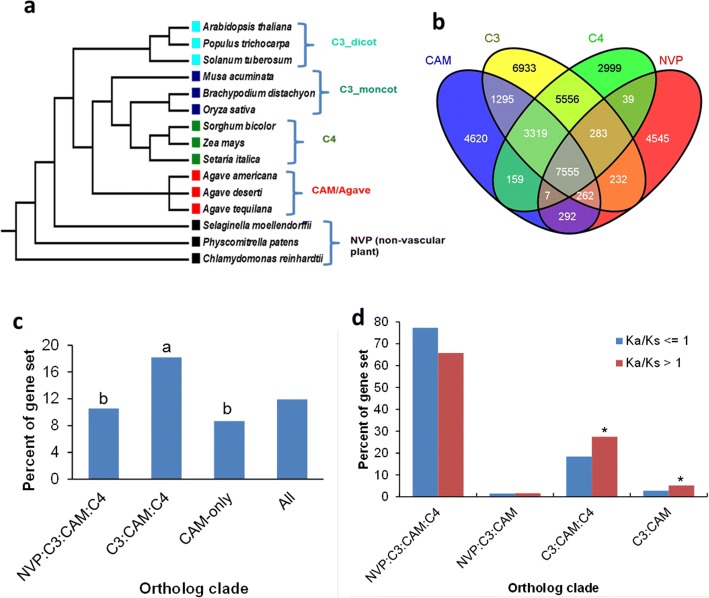
Fig. 2.
Comparative analysis of protein sequences among CAM and non-CAM plant species. a Plant species used in comparative genomics analysis. b Ortholog groups in 15 plant species as identified by OrthoMCL. Number of ortholog groups is listed in each of the ortholog clades. c Percent of ortholog clade were predicted to be transcription factors in Agave americana. “a” and “b” indicate that the transcription factors are over-represented (p < 0.05) and under-represented (p < 0.05), respectively. d Percent of ortholog clade undergoing positive selection (i.e., nonsynonymous to synonymous substitution ratio (Ka/Ks) > 1, as calculated from Agave-Arabidopsis gene pairs with a sliding window of 50 amino acids). “*” indicates that the ortholog clade was over-represented (p < 0.0001) by Agave genes with Ka/Ks ratio greater than 1. Clade NVP:C3:CAM:C4 is shared by NVP, C3, CAM, and C4; NVP:C3:CAM shared only by NVP, C3, and CAM; C3:CAM:C4 shared only by C3, CAM, and C4; C3:CAM shared only by C3 and CAM; and CAM-only is specific to CAM species

