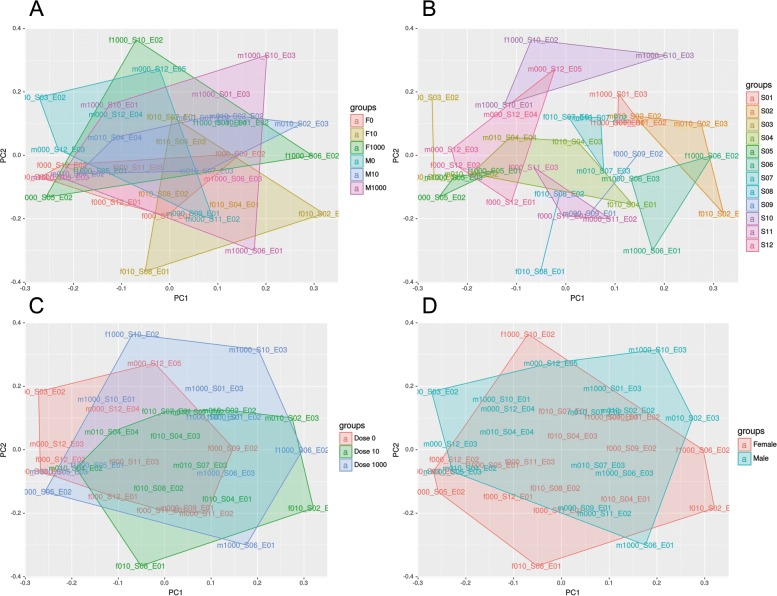
Fig. 3.
Multiple scaling plot of the top 200 on isomiR level: showing a the different treatment groups of male and female embryos with dose 0 (control), 10 (low) and 1000 (high), respectively (ng/µg E2 per kg body weight per day), b the grouping of the mother sows, c the grouping of the different doses and d the grouping of female and male sex

