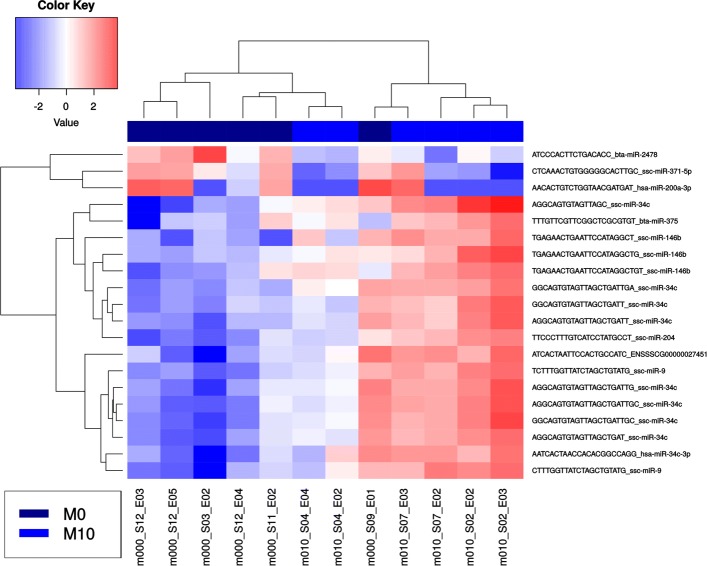
Fig. 4.
Heatmap of male low dose versus male control treatment (FDR 0.05): The x-axis shows the different samples of the two compared groups M0 and M10 (M0: male embryo control group; M10: male embryos low dose group). The y-axis shows the potential differentially expressed sequences (isomiRs) obtained in the respective comparison. Mean-centered log2 CPM values are shown

