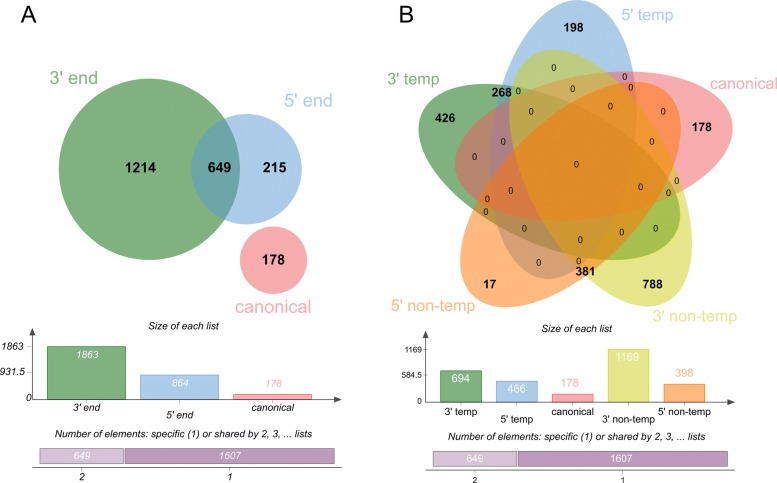
Fig. 7.
Detected miRNA isoforms (isomiR): The Venn Diagram on the left (a) represents the number of different detected isomiR on sequence level organized by the modification types. The Venn Diagram on the right (b) represents the number of different detected isomiRs on sequence level split into templated and non-templated forms

