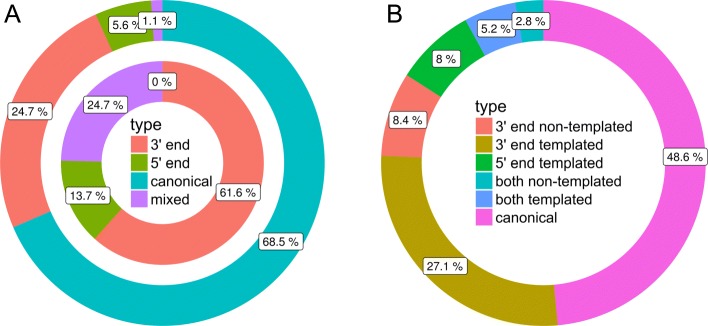
Fig. 9.
Top expressed isomiRs: The donut plot on the left (a) represents the top (rank 1) expressed isomiRs per miRNA group. The outer cycle shows miRNA groups containing the canonical form (mature form of the database) and the inner ring are miRNA groups without the canonical form present. The plot on the right (b) shows the top expressed isomiRs on sequence level organized by templated versus non-templated

