
Figure 1.
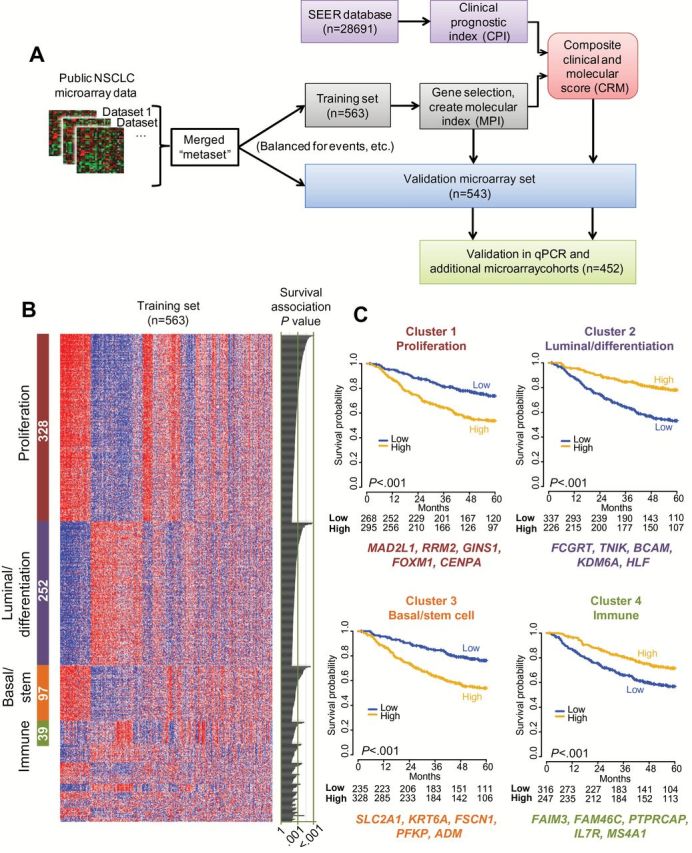
Identification and selection of prognostic genes from nonsquamous non–small cell lung cancer (NSCLC) gene expression datasets. A) Schematic representation of the study design for prognostic gene discovery and validation. B) Clustering of the top 1012 prognostic genes (rows) in the training set of 563 patients (columns) by AutoSOME (36) revealed four dominant clusters comprising 71% (n = 716) of the genes; statistically significant cluster annotations are indicated in Supplementary Table 4 (available online). The heatmap reflects relative mRNA expression levels. The number of genes in each cluster is indicated (white text within colored bars to left), with univariate estimates of prognostic value for each gene depicted as likelihood ratio P values from Cox regression in the training set on the right of the panel. C) Kaplan-Meier survival analysis in the microarray training set; cases were split into “high” and “low” sets according the median of the integrated expression of the genes in each of the four largest clusters from (B). The top five most robustly prognostic genes are indicated below each cluster. P values in KM plots are from log-rank test (two-sided). NSCLC = non–small cell lung cancer; qPCR = quantitative polymerase chain reaction; SEER = Surveillance, Epidemiology, and End Results.