
Figure 3.
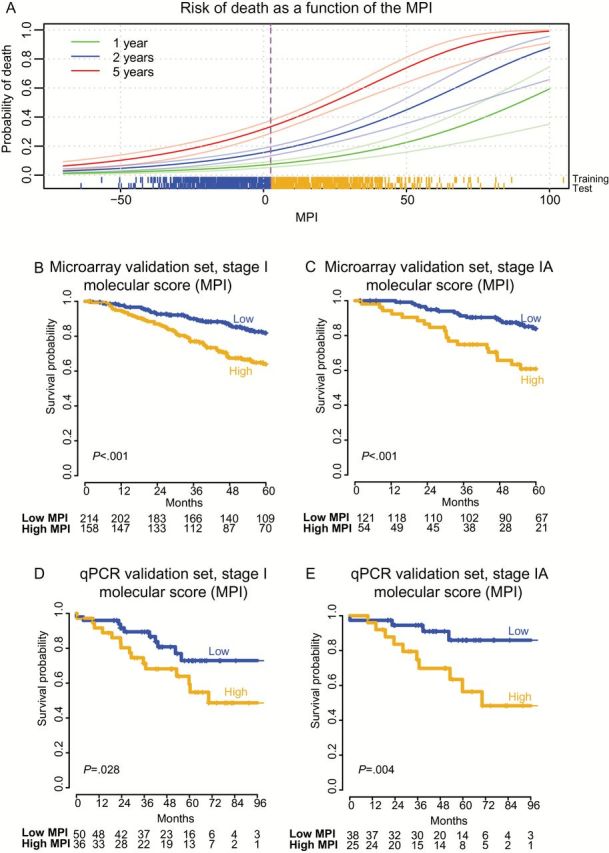
A nine-gene expression-based molecular prognostic index (MPI) predicts risk of death in stage I nonsquamous non–small cell lung cancer (NSCLC). A) Distribution of the MPI and its relationship to survival in the training set, with survival modeled as a continuous function of the score. Scores for individual patients are depicted as a “rung” above the x-axis for the meta-cohort microarray training and test sets. Sigmoidal lines depict mean mortality rates (darker green, blue, and red lines) and corresponding 95% confidence interval (lighter colored lines), based on Kaplan-Meier estimates of one, two, and five years, respectively. Dichotomous patient stratification of the MPI relative to the training set (median MPI = 2.96, vertical dotted line) define two mortality risk strata as depicted in panels (B-E). B and C) Kaplan-Meier analysis of overall survival in the meta-cohort microarray validation set with stratification of risk groups based on the median value of the MPI from the training set. D and E) Kaplan-Meier survival analysis of the quantitative polymerase chain reaction validation set with risk groups defined by the median MPI value in the training set. P values for the MPI are calculated by log-rank test (two-sided). Numbers at risk are indicated below axes, and tick marks on curves indicate censoring. MPI = molecular prognostic index.