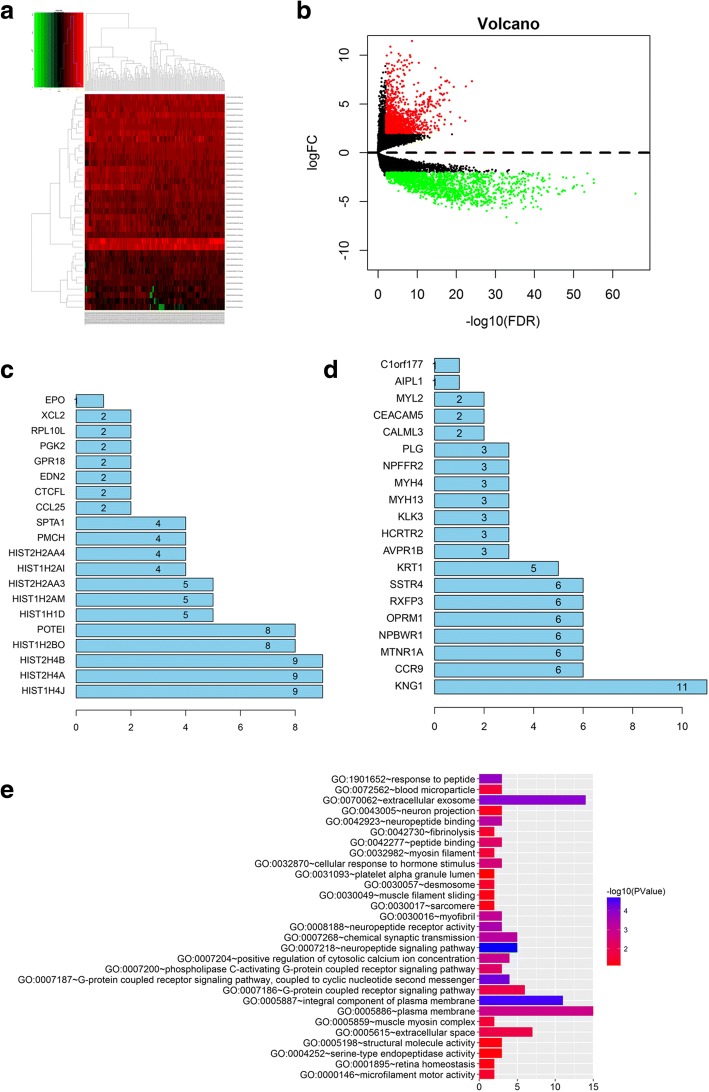
Fig. 1.
Identification of core genes in screened differentially expressed genes (DEGs). a Heatmap of DEGs. DEMs with log2FC > 1 were red; DEMs with log2FC < − 1 were green. b Volcano plot of DEGs. DEGs with log2FC > 1.5 were expressed in red; DEGs with log2FC < − 1.5 were in green (P < 0.05). The down-regulated DEGs (c) and up-regulated DEGs (d) were identified. e The GO analysis of KNG1

