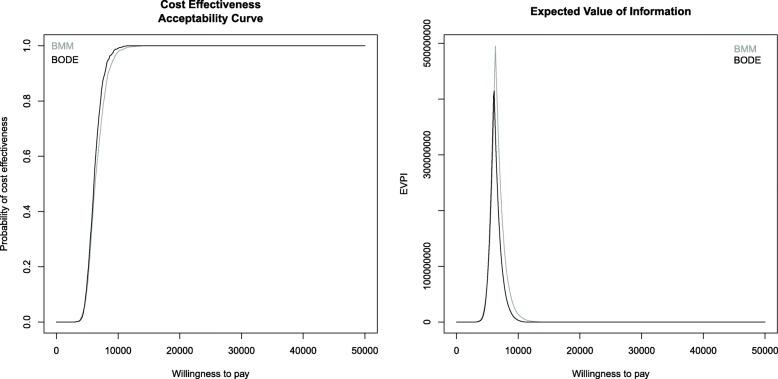
Fig. 4.
Cost-effectiveness acceptability curves and expected value of information of the Bayesian ODE system and Bayesian Markov model. The results of the BMM are displayed in grey, whereas those of the BODE are shown in black. The amount of parameter uncertainty is higher in the BMM. The CEACs in the left panel reach values of 80% at a willingness-to-pay corresponding to the ICERs. The EVPIs for the whole population at around £ 500,000,000 and £ 400,000,000 in the BMM and BODE, respectively, are shown in the right panel

