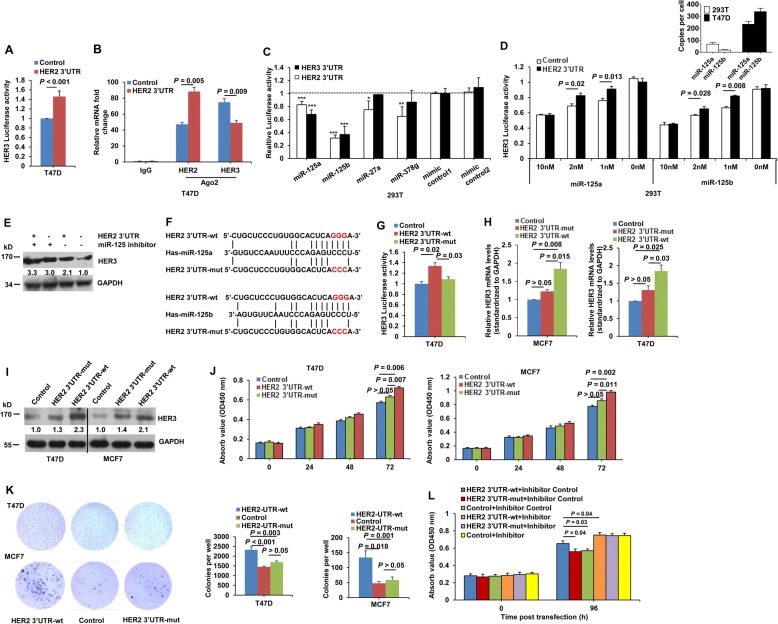
Fig. 3.
The HER2 3’UTR affects HER3 expression via miR125a/b. a HER3 3’UTR-luciferase reporter assay in T47D cells transfected with the HER2 3’UTR or control vector. b Lysates from T47D cells transfected with the HER2 3’UTR or control vector underwent immunoprecipitation with an anti-Ago2 antibody. Immunoprecipitated RNAs were recovered, and real-time PCR was performed using primers targeting the HER2 and HER3 3’UTRs. c 293 T cells were co-transfected with a luciferase reporter, the HER2 or HER3 3’UTR, the indicated miRNA mimic, or control mimic, respectively, and luciferase activities were measured using a dual-luciferase assay kit 48 h post transfection; see also Table S3. P < 0.05 (*) and P < 0.01 (**) compared to control transfections. d Lower panel, 293 T cells were co-transfected with HER3 3’UTR luciferase reporter constructs, the indicated dose of miR-125a or miR-125b mimics, and HER2 3’UTR or empty control plasmids. The luciferase activities were measured 48 h post transfection. Upper panel, copies-per-cell analysis of miR-125a/b in T47D and 293 T cells. e Western blotting of HER3 protein levels in T47D cells transfected with the HER2 3’UTR or control vector, along with miR-125a/b inhibitors or a randomized oligonucleotide (control). f Schematic representation of miR-125a/b response elements within the HER2 and HER3 3’UTR. Perfect matches are indicated by a line. Mutations were made in the seed region of the miR-125a/b binding sites. g Luciferase activity of the HER3 3’UTR reporter in T47D cells transfected with wild-type (wt) or mutant (mut) HER2 3’UTR or empty vector as a control. h-k MCF7 or T47D cells were transfected with wild-type or mutant HER2 3’UTR or empty vector as a control. Real-time PCR (h) and western blotting (i) were performed to determine HER3 mRNA and protein levels 24 and 48 h post transfection. Cell proliferation (j) and colony forming (k) were measured by CCK8 and clonogenic assays 72 h and 7 d post transfection, respectively. l Proliferation of T47D cells cotransfected with wild-type or mutant HER2 3’UTR or empty vector as a control, along with miR-125a/b inhibitors or a randomized oligonucleotide (control). All error bars represent the standard deviation. All quantitative data were generated from a minimum of three replicates

