Fig. 5.
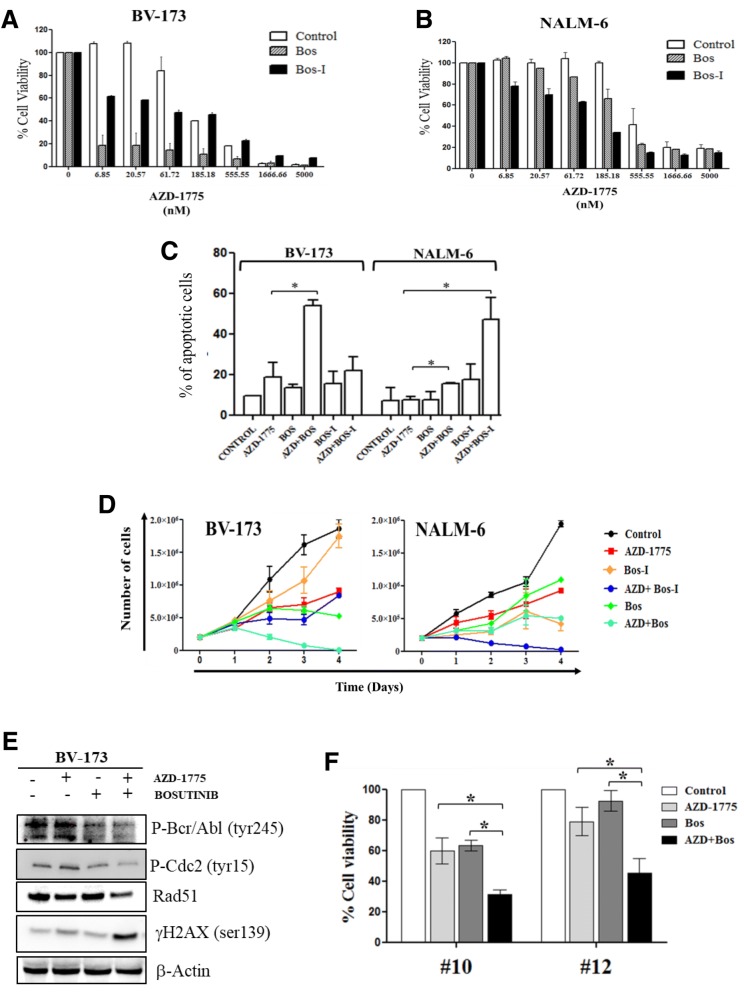
AZD-1775 enhances the toxicity of tyrosine kinase inhibitors in ALL cell lines and leukemia primary samples. a Cell viability analyses of BV-173 cell line incubated simultaneously with AZD-1775 (6 to 5000 nM, dilution rate 1:3) and with bosutinib authentic (50 nM) or bosutinib isomer (50 nM) for 48 h. In the graph: AZD-1775 (control, white columns), bosutinib (Bos, gray columns), and bosutinib isomer (Bos-I, black columns). The percentage of viable cells is depicted relative to the untreated controls. Data were used to determine CI values. b Cell viability analyses of NALM-6 cell line incubated with AZD-1775 (6 to 5000 nM, dilution rate 1:3) and with bosutinib authentic (2 uM) or bosutinib isomer (2 uM) for 72 h. In the graph: AZD-1775(control, white columns), bosutinib (Bos, gray columns), and bosutinib isomer (Bos-I, black columns). The number of viable cells is depicted as a percentage of the untreated controls. Data were used to determine CI values. c Apoptosis analyses of BV-173 and NALM-6 cells after 24 h of incubation with AZD-1775 (185 nM) and bosutinib authentic/isomer (BV-173 50 nM; NALM-6 2 uM). The percentage of apoptotic cells was detected after Annexin V/propidium iodide staining. d Growth curve of BV-173 and NALM-6 treated for 4 days with AZD-1775 (185 nM) and bosutinib authentic/bosutinib isomer (BV-173 50 nM; NALM-6 2 uM). e Immunoblotting analysis of BV-173 treated with AZD-1775 (185 nM) and bosutinib (50 nM) for 24 h. β-actin was used for loading normalization. f Cell viability analysis in primary leukemic cells isolated from two adult BCR-ABL1-positive ALL patients treated with AZD-1775 (5 uM) and bosutinib authentic (2 uM) for 24 h. The percentage of viable cells is depicted relative to the untreated controls. Controls in all panels are cells treated with DMSO 0.1%. *p ≤ 0.05

