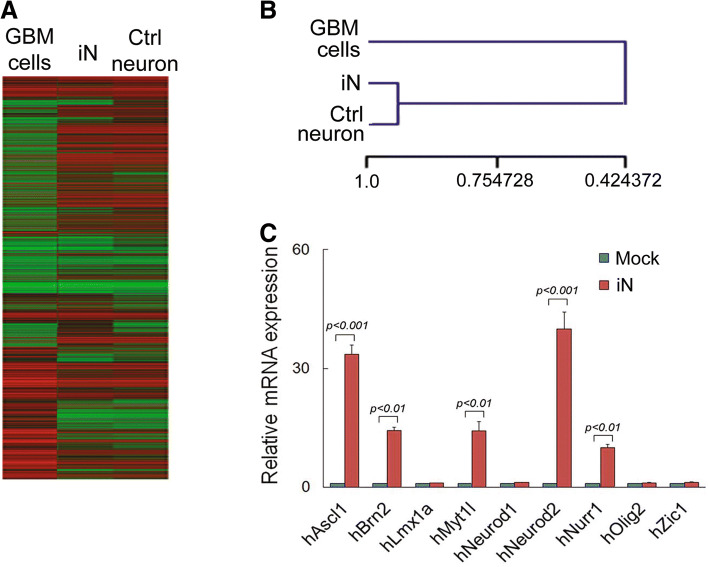
Fig. 3.
Global gene expression profiling of GBM and iNs. a Heat-map of differentially genes expressed was generated for GBM U118 (WT) and iNs. Positive control neurons are induced from IMR90 fibroblasts by p53 knockdown [49]. b Hierarchical clustering was performed. c qRT-PCR results show relative mRNA levels of defined transcription factors in GBM U118 control and iNs (n = 3)

