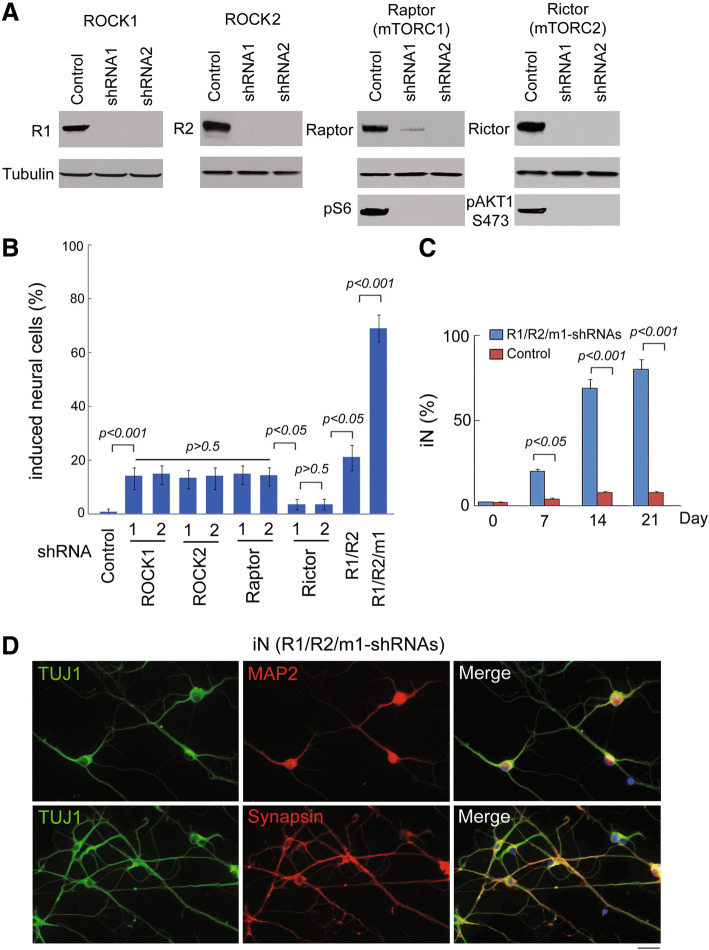
Fig. 4.
Effects of ROCK1/2 and mTORC1 shRNAs on GBM cell conversion. a Western blot analysis from U118 cells showed that shRNA1 and shRNA2 of ROCK1/2 and mTORC1 (Raptor) /C2 (Rictor) are sufficient to inhibit ROCK1/2, Raptor or Rictor expression, respectively. Expressions of downstream targets pS6 for Raptor and pAKT1-S473 for Rictor were reduced by Raptor or Rictor shRNAs. R1: ROCK1, R2: ROCK2. b GBM U118 cells were transduced with ROCK1/2 and mTOR1/2 shRNAs and then cultured in induction medium. Positive induce neural cells were counted using RFP-positive staining and quantified on day 7. The histogram represents the ratio of normalized data between treatment with shRNAs or DMSO. R1: ROCK1, R2: ROCK2, m1: mTORC1. c Kinetic analysis was performed for iNs after induction with ROCK1/2-mTORC1 shRNAs in induction medium (induction for the first week) and neuronal mature medium (induction after 1 week). iN cells was quantified as MAP2 positive cells. Quantitative data are the mean ± SEM from three independent experiments. d Expression of TUJ1, MAP2 and Synapsin in iNs was examined 3 weeks after induction with ROCK1/2-mTORC1 shRNAs. Scale bar, 10 μm

