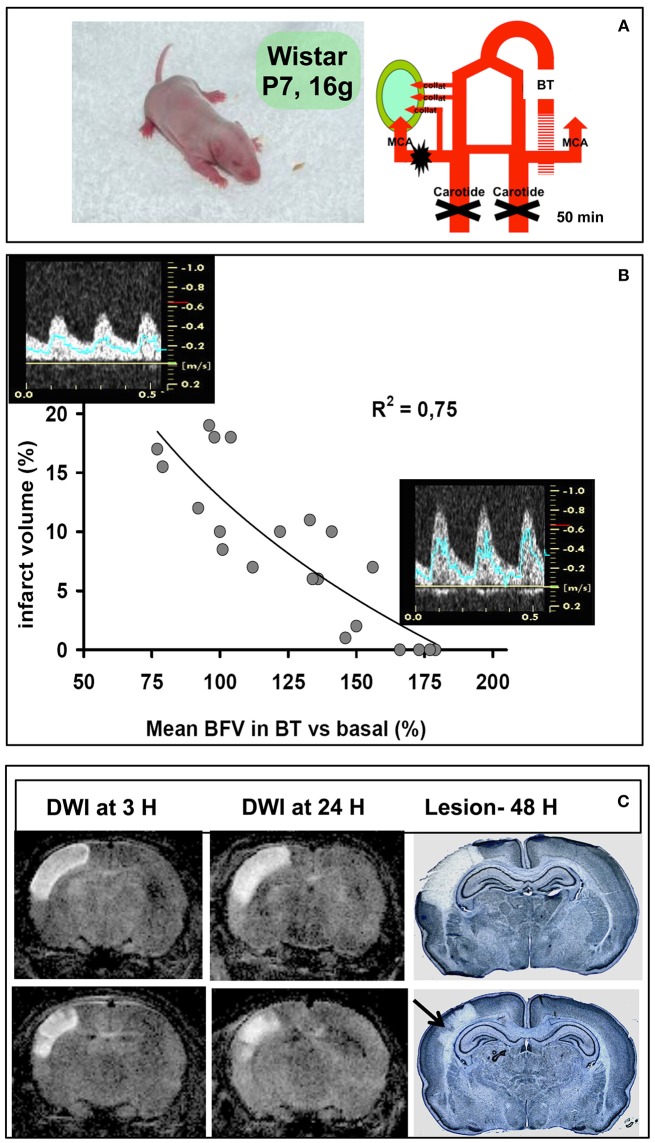
Figure 1.
Ischemia-reperfusion in the P7 rat pup. (A) Schematic diagram of the model (left) with electrocoagulation of the left MCA and transient (50 min) left and right CCA occlusion (right). The lesion is indicated with the green area, which depends from the presence (or not) of collaterals. (B) Regression between percentage of the ischemic lesion volume and percentage of mean blood-flow velocity (mBFV) measured in the basilar trunk (BT). Images of pulsed Doppler signals obtained in animals with a large lesion (left) compared to animals with a small lesion and/or without a lesion (right). (C) Diffusion-weighted MRI images (DWI) obtained at 3 and 24 h of reperfusion, and subsequent pale lesion observed on cresyl violet-stained coronal sections.

