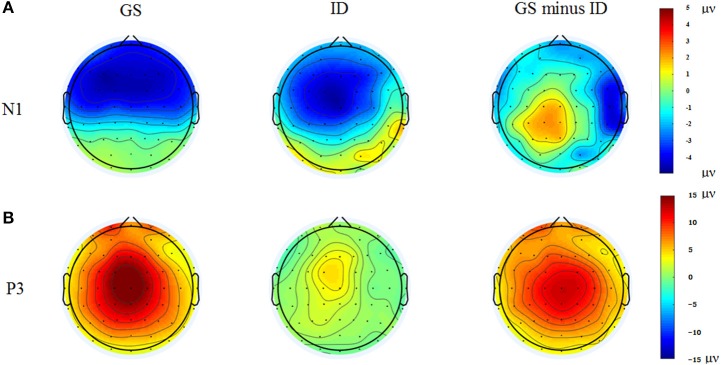
Figure 4.
Topographic maps of the N1 (80–180 ms, A) and P3 (230–400 ms, B) components time-locked to the auditory stop-signal in the successful stop trials. Left: Topographic maps of each ERP component for the group of good sleepers (GS). Middle: Topographic maps of each ERP component for the group of insomnia disorders (ID). Right: Topographic maps of each ERP component for the GS minus ID.

