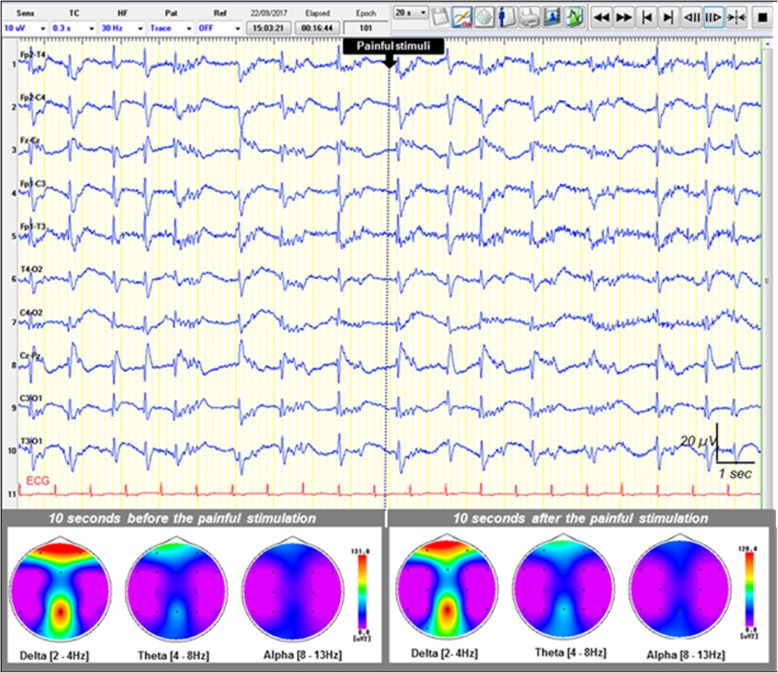
Fig. 2.
Example of a nonreactive electroencephalogram (EEG) following painful stimulus (pinching) in a patient with impaired consciousness. Upper: A 20-second epoch EEG sample showing generalized pseudoperiodic discharges of spikes with no change after the painful stimulus (pinching) in a postanoxic ICU patient. Recording: 20 mm/s, sensitivity: 10 μV/mm; filter settings: 0.50–70 Hz. Lower: EEG spectral power featuring topographic mapping of power of each main EEG frequency band (delta, theta, and alpha) computed 10 seconds before and 10 seconds after the painful stimulus. No significant EEG frequency band power change was observed after the painful stimulus. Higher-power values are shown in warm colors, and cool colors depict lower power

