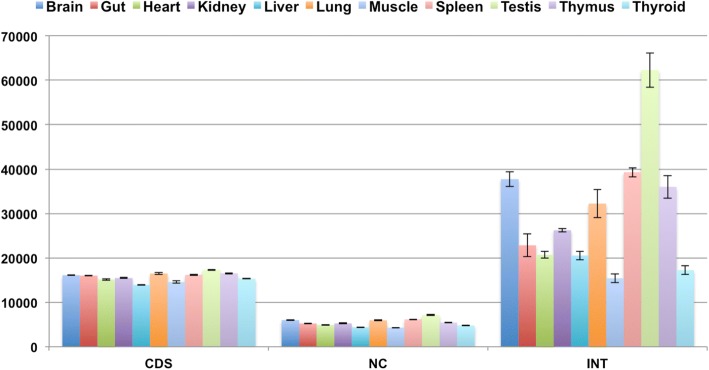
Fig. 2.
Numbers of transcripts in tissues. Numbers of transcripts found in each sampled tissue for the three classes CDS (annotated coding transcripts), NC (annotated non-coding transcripts) and INT (non-annotated intragenic transcripts). Averages were taken across all three populations, the error bars represent the standard error of the mean. Additional file 1 includes the corresponding data for this figure

