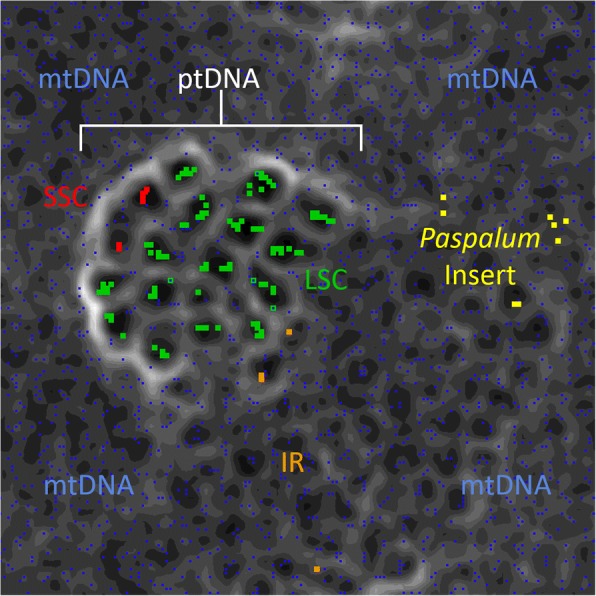
Fig. 3.

ESOM of mtDNA and partitions of ptDNA sequences based on tetranucleotide frequency. The mtDNA is in blue with the ptDNA divided into LSC (green), SSC (red), IR (orange), and the Paspalum inserts (yellow). High ‘elevations’ are in white visualizing major distances in tetranucleotide frequency, while ‘low elevations’ are in darker grays showing similarity in tetranucleotide frequency
