
Fig. 3.
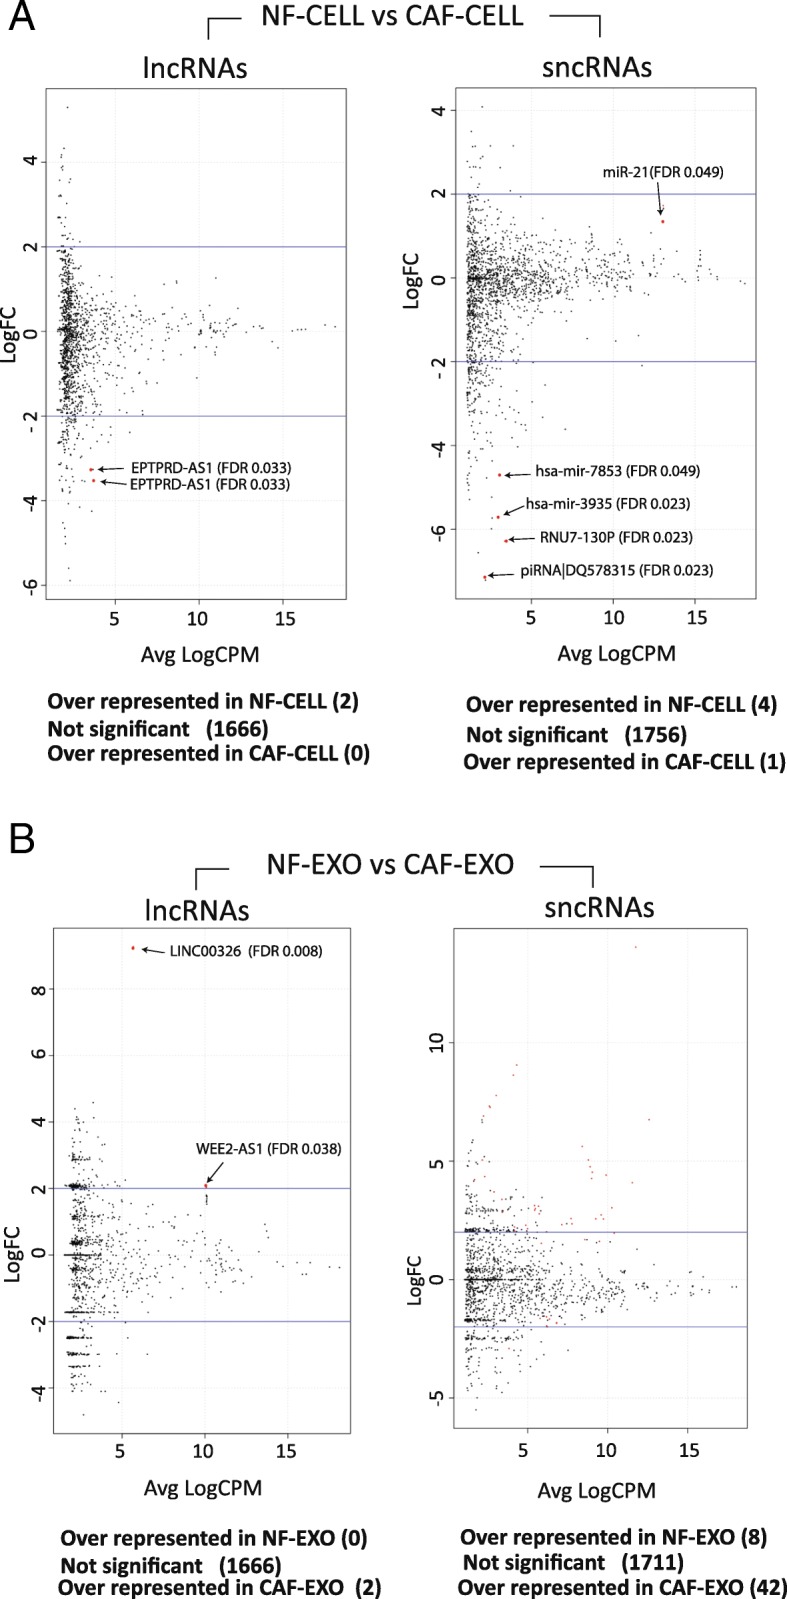
a Volcano plots from the differential expression analyses of lncRNAs and sncRNAs in NF-CELL and CAF-CELL samples. Red dots are significant ncRNAs supported by FDR < 0.05 and are 2× increased to let the reader see them clearly. Names for significant ncRNAs are also included. b Volcano plots from the differential expression analyses of lncRNAs and sncRNAs in NF-EXO and CAF-EXO samples created using similar criteria for the volcano plot previously shown in plot A. For more information about the 42 significant sncRNAs (red dots) see Additional file 11: Table S1