Fig. 3.
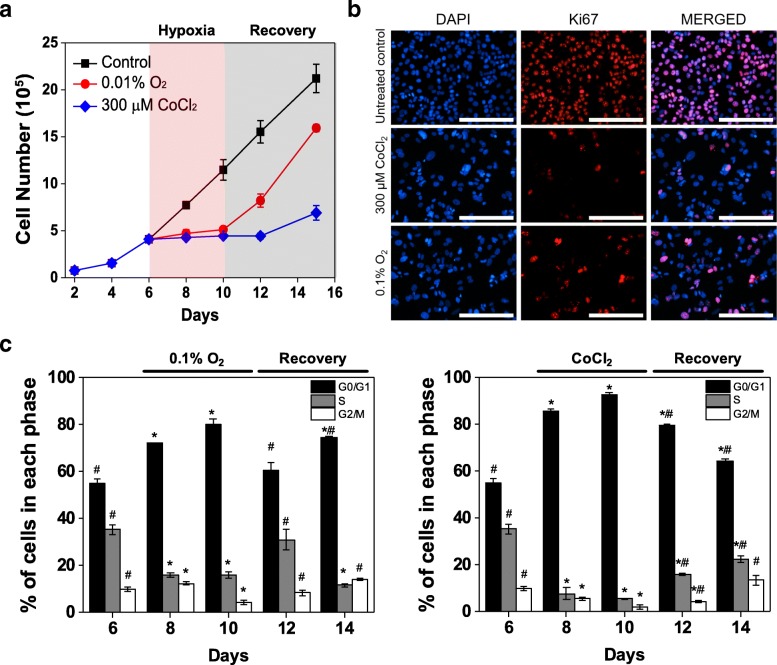
Induction of quiescence by CoCl2 treatment is similar to effects of true hypoxia. a Cell growth analysis of MCF-7 cells treated with 300 μM CoCl2 or true hypoxic conditions (0.1% O2) for 4 days (from day 6 to day 10) compared to untreated cells. b Representative fluorescence images of Ki67 expression in MCF-7 cells after 6 days of exposure to 300 μM CoCl2 or 0.1% O2 compared to untreated control cells (day 6 of culture). Nuclei were stained with DAPI. Scale bars indicate 200 μm. c Flow cytometric analysis of PI staining in cells exposed to true hypoxic conditions (0.1% O2, left) or 300 μM CoCl2 treatment (right). Cell populations are reported as percentage of cells in each phase. Data were analyzed by Modfit LT software (* P < 0.05 compared to untreated control (day 6); # P < 0.05 compared to day 10 of the respective condition)

