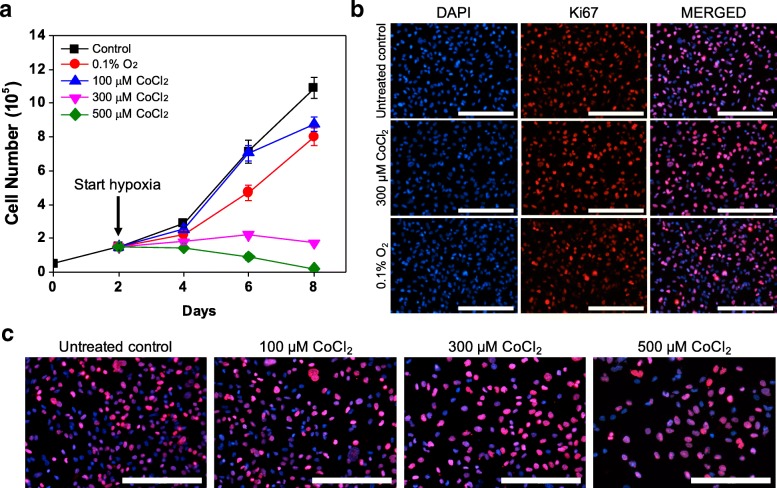
Fig. 6.
In vitro cellular responses to hypoxia in ER-negative MDA-MB-231 cells can be mimicked by CoCl2. a Cell growth analysis of MDA-MB-231 cells treated with CoCl2 (100, 300 and 500 μM) or true hypoxic conditions (0.1% O2) for 6 days (from day 2 to day 8) compared to untreated cells. b Representative fluorescence images of Ki67 (red) and nuclei (blue) in MDA-MB-231 cells after 4 days of treatment with 300 μM CoCl2 or 0.1% O2, compared to untreated control cells (day 2 of culture). c Representative fluorescence images of Ki67 (red) and nuclei (blue) in MDA-MB-231 cells at day 6 (after 4-day CoCl2 treatment) compared to untreated control cells (day 2 of culture). Scale bars indicate 200 μm

