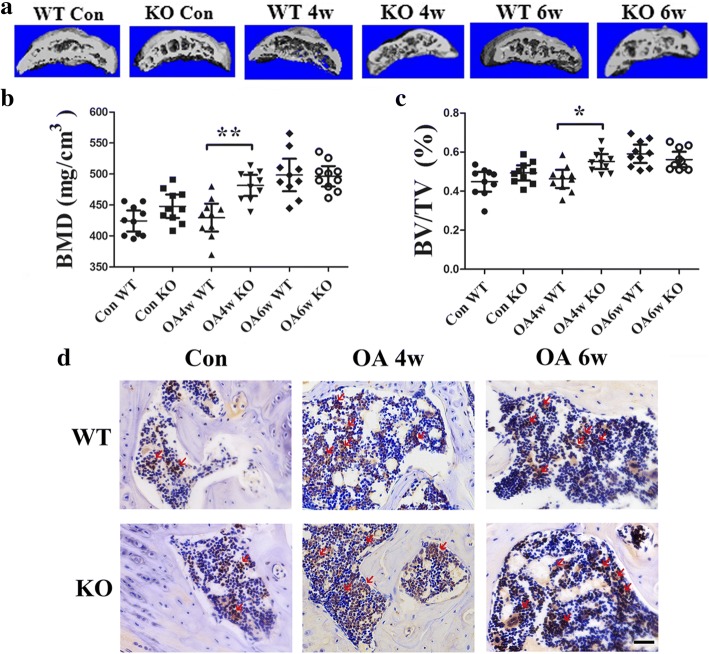
Fig. 3.
a 3D μCT images of the tibia subchondral bone medial compartment (sagittal view) of mice in all groups. Quantitative analysis of structural parameters of subchondral bone by μCT. b Bone mineral density (BMD) and c bone volume/total tissue volume (BV/TV), n = 10 per group. *p < 0.05, compared with the wild-type (WT) osteoarthritis (OA) mice at 4 weeks (4w). d Immunohistochemical analysis of Osterix-positive cells (brown, red arrow) in the tibial subchondral region. The result showed that GPR120 knockout (KO) mice significantly increased the numbers of Osterix-positive cells in subchondral bone compared with the WT mice 4 week after OA surgery. Scale bar = 50 μm. 6w 6 weeks, Con sham control

