Fig. 7.
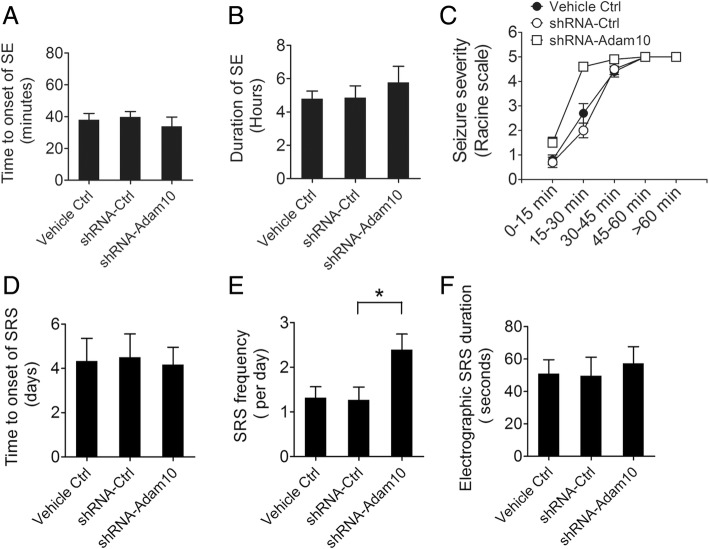
Adam10 knockdown increases spontaneous seizures in TLE mice. a Bar graph showing the average time to onset of SE in the Vehicle Ctrl, shRNA-Ctrl, and shRNA-Adam10 mice (n = 12). b Bar graph showing the quantification of SE duration in the Vehicle Ctrl, shRNA-Ctrl, and shRNA-Adam10 mice (n = 10). c Line graphs showing the seizure severity during SE development in the Vehicle Ctrl, shRNA-Ctrl, and shRNA-Adam10 mice (at 15–30 min, F2,27 = 19.95, p < 0.001, shRNA-Adam10 vs Vehicle Ctrl; p < 0.001, shRNA-Adam10 vs shRNA-Ctrl) (n = 10). d Bar graph showing the average time to onset of the first spontaneous seizure in the Vehicle Ctrl, shRNA-Ctrl, and shRNA-Adam10 mice (n = 6). e Bar graph showing the SRS frequency in the Vehicle Ctrl, shRNA-Ctrl, and shRNA-Adam10 mice (F2,15 = 4.55, p = 0.043, shRNA-Adam10 vs shRNA-Ctrl) (n = 6). f Bar graph showing the quantification of electrographic SRS duration in the Vehicle Ctrl, shRNA-Ctrl, and shRNA-Adam10 mice (n = 6). *p < 0.05 and one-way ANOVA

