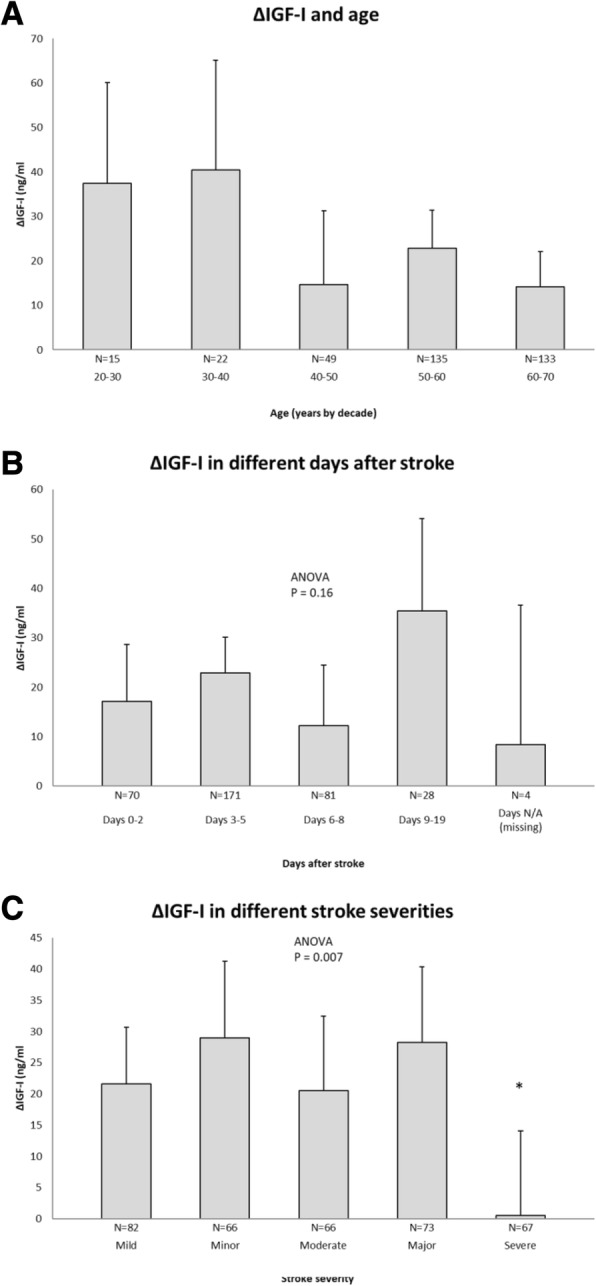
Fig. 2.

Descriptive data on ΔIGF-I in relation to age, sampling day, and ischemic stroke (IS) severity. The error bars are 95% confidence intervals (CI), and the numbers (N) of subjects in each category are shown. a ΔIGF-I for patients of different ages, as expressed by age decade at index IS. b ΔIGF-I values for different days post-IS. c ΔIGF-I values for the five IS severity levels of the National Institutes of Health Stroke Scale (NIHSS) (for limits and details, see Methods section). Significance levels were analyzed by ANOVA, followed by post-hoc Dunnett’s test with the first group as reference. If the ANOVA was non-significant no further testing was performed. *p < 0.05
