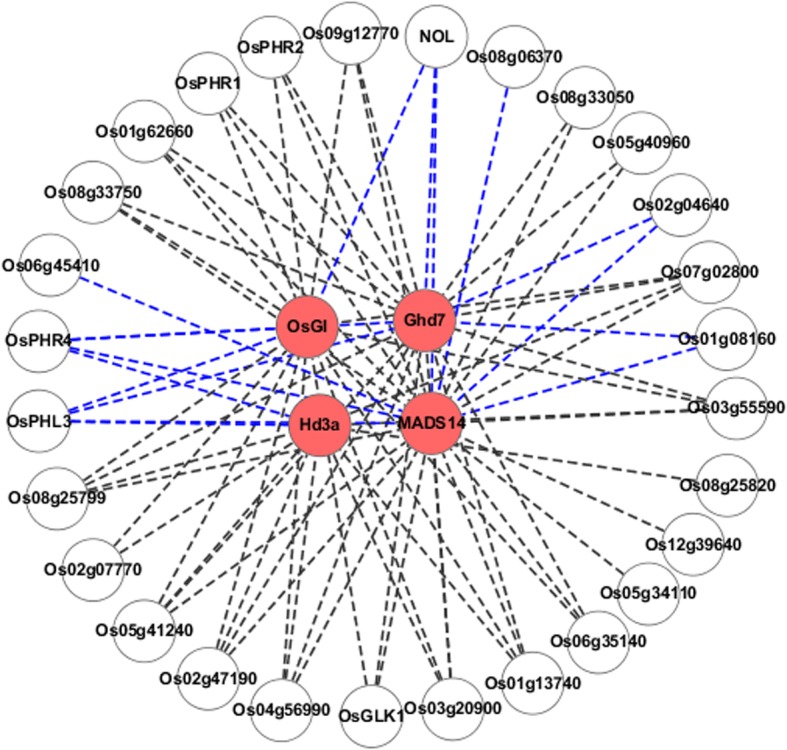
Fig. 1.

Co-expression networks of rice G2-like transcription factors and flowering time regulators. Co-expression network between flowering time regulators and G2-like transcription factors based on a Pearson correlation coefficient cutoff of 0.6. Nodes in the maps represent genes. Red node represents the flowering- time genes in photoperiodic pathway. The blue lines connecting two genes represent transcription factors negatively co-expressed with photoperiodic flowering pathway genes. Black lines connecting two genes represent transcription factors positively co-expressed with photoperiodic flowering pathway genes
