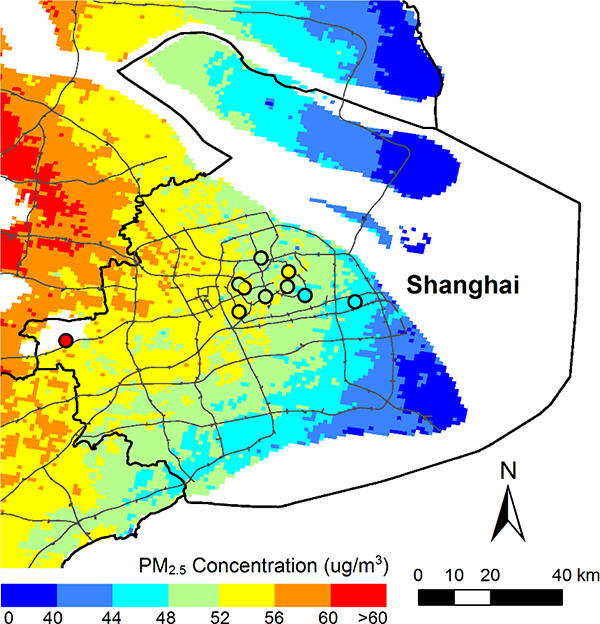
Figure 1.

Annual average PM2.5 concentrations from gap-filled satellite predictions and central-site measurements (shown as colors in the circle) in 2014. The boundary of Shanghai (black line) and the main roads (thin grey lines) are overlaid on the map.
