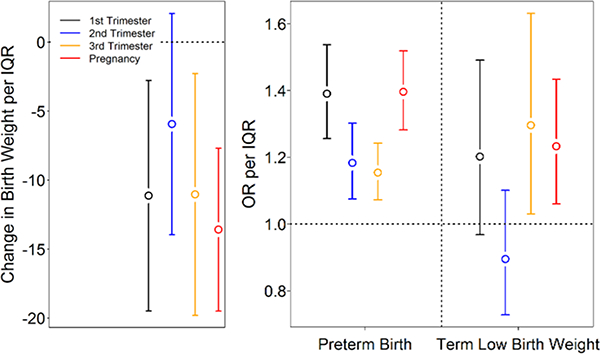
Figure B.1.

Adjusted health effect estimates per IQR increase in PM2.5 exposures during each trimester and entire pregnancy for births between 2011 and 2014, using exposure assessed from gap-filled satellite predictions. Left: adjusted birth weight change among term births and 95% confidence intervals. Right: adjusted odds ratio (OR) and 95% confidence intervals for preterm birth and term low birth weight.
