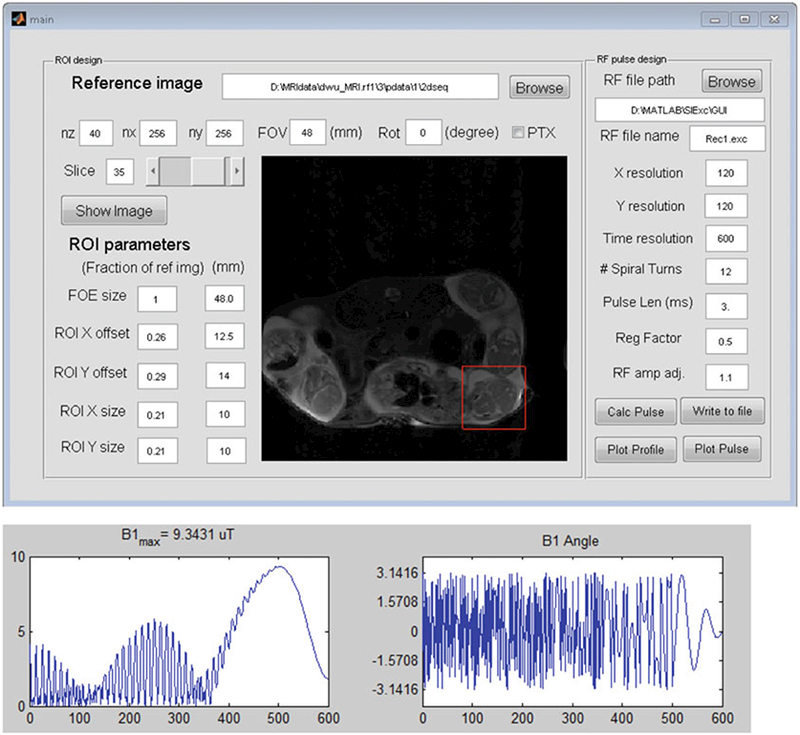
Fig. 3.

Definition of the field of excitation (FOE, represented by the red box) based on the 2D multi-slice T2-weighted images using a software tool. Using the software, users can display the T2-weighted images, define the size and spatial offsets of an FOE, and calculate the selective excitation RF pulse to excite the FOE with the desired parameters. The lower panel displays the amplitude and phase profiles of the generated RF pulse
