
Extended Data Figure 2.
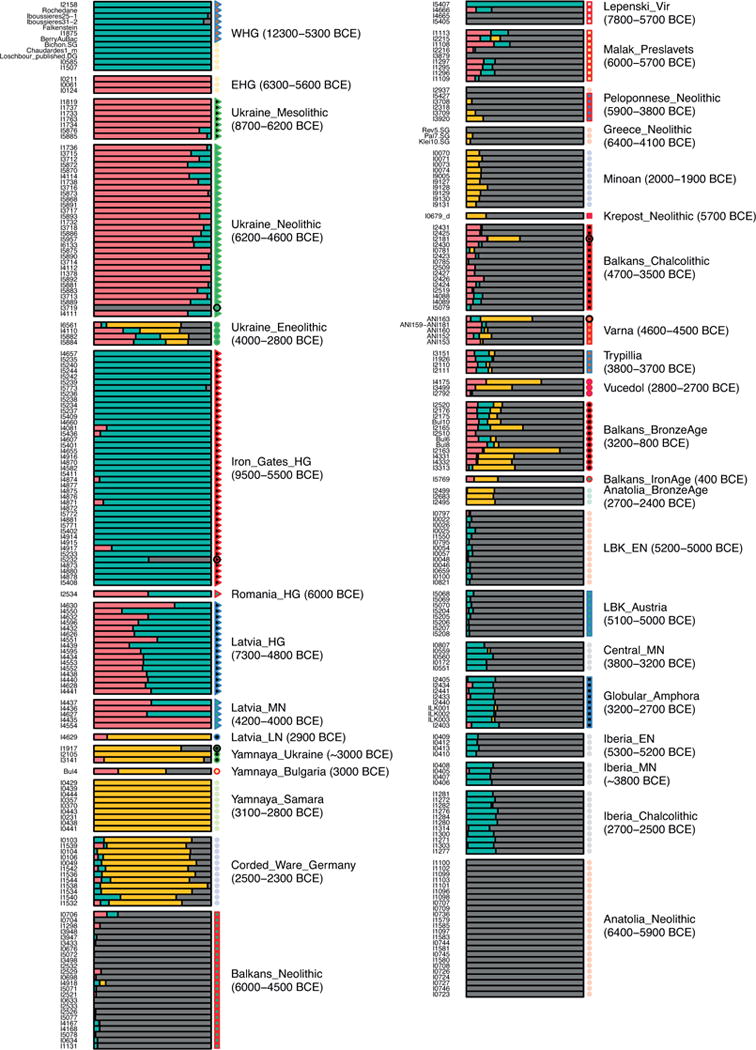
Supervised ADMIXTURE analysis modeling each ancient individual (one per row), as a mixture of populations represented by clusters that are constrained to contain Anatolian Neolithic (grey), Yamnaya from Samara (yellow), EHG (pink) and WHG (green) populations. Dates in parentheses indicate approximate range of individuals in each population. This differs from Figure 1D in that it contains some previously published samples, and includes sample IDs.