
Figure 2. Structure and change in hunter-gatherer-related populations.
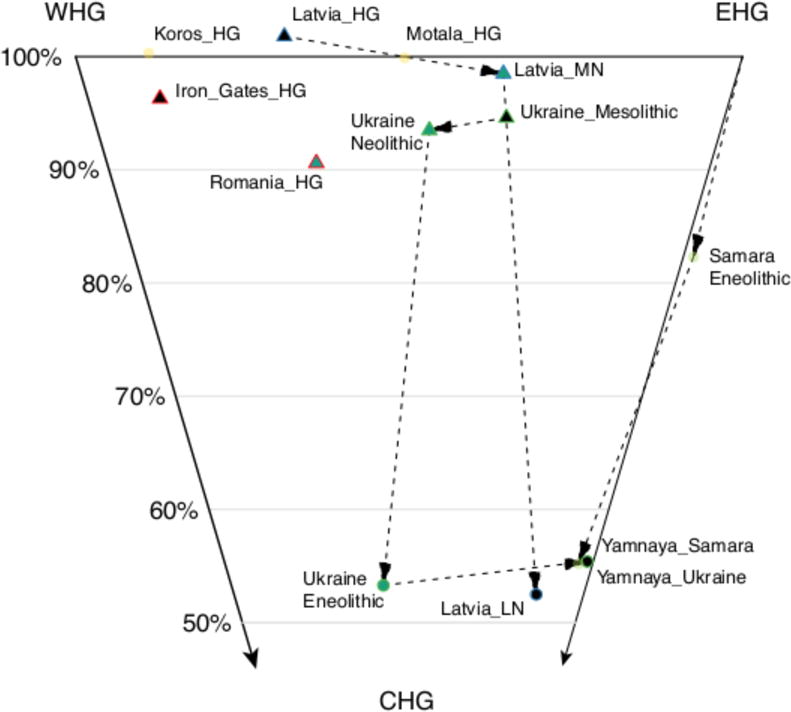
Inferred ancestry proportions for populations modeled as a mixture of WHG, EHG and CHG (Supplementary Table S3.1.3). Dashed lines show populations from the same geographic region. Percentages indicate proportion of WHG+EHG ancestry. Standard errors range from 1.5-8.3% (Supplementary Table S3.1.3).