
Fig. 6.
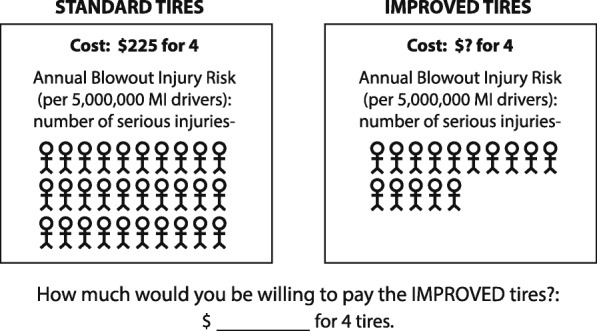
Icon arrays used to illustrate the risk of standard or improved tires. Participants were tasked with deciding how much they would pay for the improved tires. Note the base rate of 5 M drivers was represented in text. Redrawn from “Effects of numerical and graphical displays on professed risk-taking behavior” by E. R. Stone, J. F. Yates, & A. M. Parker. 1997, Journal of Experimental Psychology: Applied, 3(4), 243